Knowledge Organiser
1.7.1 Understanding Market Failure
- What is the definition of market failure?
- How does market failure relate to allocative efficiency?
- Define the term: Externality
- Explain the problem with Negative Externalities.
- Explain the problem with Positive Externalities.
- Define the term: Merit Good
- Define the term: Demerit Good
- Draw the MSC/MSB diagram for: Negative Externalities in Production
- Draw the MSC/MSB diagram for: Negative Externalities in Consumption
- Draw the MSC/MSB diagram for: Positive Externalities in Consumption
- (Bonus): Draw the MSC/MSB diagram for: Positive Externalities in Production
- The socially optimum equilibrium occurs where Marginal ________ Costs = Marginal ________ Benefits
- Allocative efficiency occurs where Marginal ________ Cost = Marginal ________ Benefit
- Without intervention, a market will produce where Marginal ________ Costs = Marginal ________ Benefits
- A Deadweight Loss will occur with Negative Externalities when consumption occurs where Marginal Social _______ is higher than Marginal Social _______
- A Deadweight Loss will occur with Positive Externalities when there is not consumption where Marginal Social _______ is higher than Marginal Social _______
- Explain why Traffic Congestion is a market failure
- Define the term: Public Goods.
- What is a Private Good?
- What does Non-Rivalrous in Consumption mean?
- What does Non-Excludable mean?
- Why is a lighthouse a Public Good?
- Why does the existence of public goods lead to market failure (the Free Rider problem)?
- Define the term: Commodity
- Define the term: Price Volatility.
- List two reasons why Commodities are likely to be price inelastic in Supply.
- List two reasons why Commodities are likely to be price inelastic in Demand.
- List three possible reasons why the Supply of Commodities would shift.
- List three possible reasons why the Demand of Commodities would shift.
- Use a Supply and Demand diagram to explain why commodity prices are volatile.
- Define the term: Common Good
- Explain why 'Tragedy of the Commons' is a type of Market Failure.
- Why is fishing commonly associated with property rights market failure?
Market failure occurs where the price mechanism fails to allocate scarce resources efficiently (allocatively efficiently) or when the operation of market forces leads to a net social welfare loss.
Market failure is defined as having a lack of allocative efficiency
Occurs when producing or consuming a good causes an impact on third parties not directly related to the transaction.
Producers and consumers only consider their private costs and benefits. The negative externality creates a social cost, so too much of the good is produced/consumed.
Producers and consumers only consider their private costs and benefits. The positive externality creates has positive spill over effects, and too little of it is produced/consumed.
Goods which are under-consumed because consumers underestimate the benefits of the goods to themselves and society.
Goods which are over-consumed because consumers do not take into account the costs these goods may have on themselves and on society.
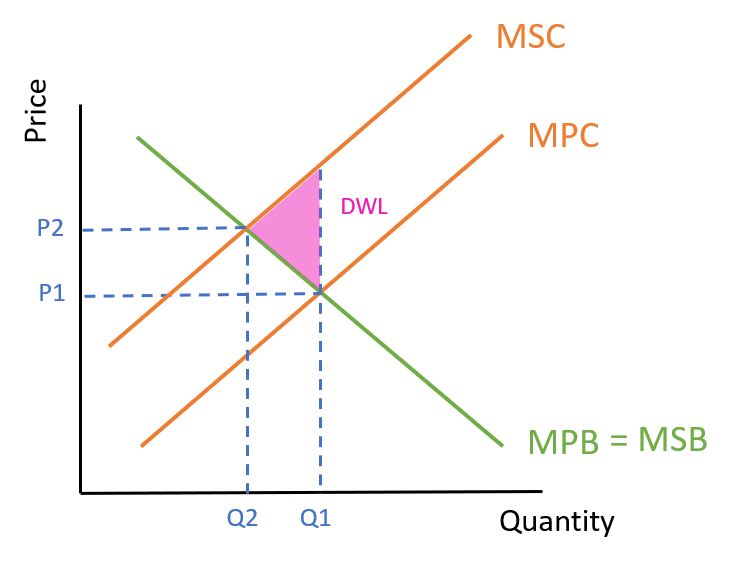


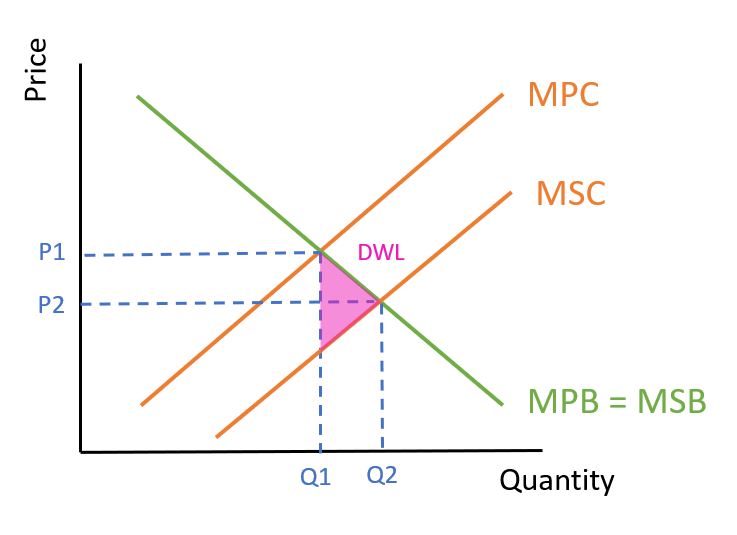
Social . . . Social
Social . . . Social
Private . . . Private
Cost . . . Benefit
Benefit . . . Cost
-Drivers only consider their private costs (e.g. fuel) -Being on the road creates a negative externality- the road is now more crowded. -Too many cars are on the road and everybody wastes their time in traffic.
A good which is: -Non-rivalrous -Non-excludable
A good which is -Rivalrous -Excludable
One person consuming the good does not stop another person consuming it.
It is not possible to prevent people who have not paid for the good to benefit from it.
-Non-rivalrous: one ship using it doesn't prevent other ships from using it. -Non-excludable: it's not possible to stop ships at sea from seeing the light.
People can benefit from using public goods without paying for them. These people are Free Riders. Because you can't charge for them, there is no incentive to supply them. So the market under-provides these goods.
A Commodity is a basic good interchangeable with other commodities of the same type. Commodities are most often used as inputs in the production of other goods or services.
Price Volatility refers to the price of a product changing rapidly and unexpectedly in a short period of time.
-They take time to produce -They may only be available in certain countries
-They are necessary for production of the final good -There are no substitutes their use.
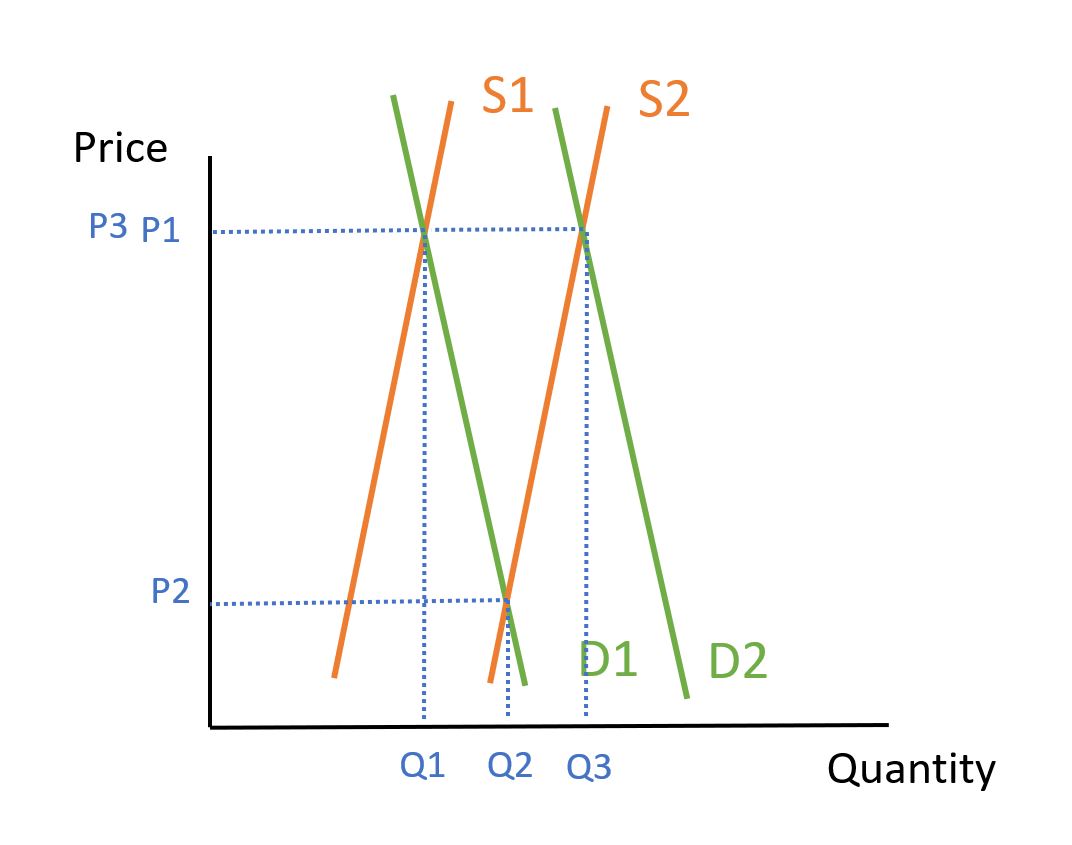
-Adverse weather makes the good scarce (shift left) -Favourable weather makes the good plentiful (shift right) -A monopoly producer decides to put more on the market (e.g. Saudi Arabia)
-Economic growth will increase demand -Recessions will decrease demand -The demand for their finished product may increase (e.g. Lithium)
-Both supply and demand curves for commodities are price inelastic. -A small shift in either supply or demand will cause a significant change in price.
-Rivalrous -Non-excludable
-Users will use the common good because it gives them individual benefit. -By using the common good, the common good is depleted (costs are paid by all). -Eventually the common good is fully depleted and not usable by anybody.
-Because anybody can go fishing (non-excludable) -Because taking fish from the sea means other people can't fish them (rivalrous)
1.7.2 Why and how governments intervene in markets
- What is a Specific tax?
- What is an Ad Valorem tax?
- How can regulation of a good be used to solve market failure?
- How can information provision be used to solve market failure?
- How does establishment of property rights (e.g. through a permit to use a good) correct market failure?
- What are the main problems with using tax to correct market failure?
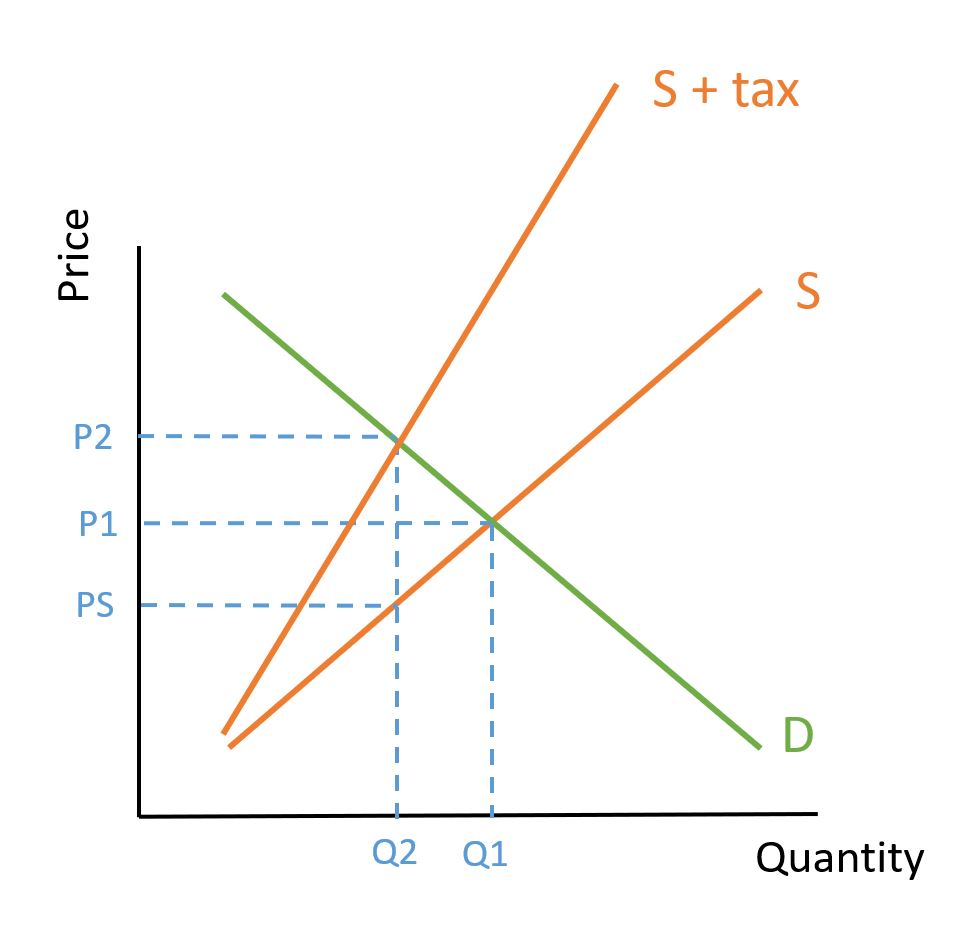
- Explain with a diagram how PED will affect the effectiveness of tax in correcting market failure.
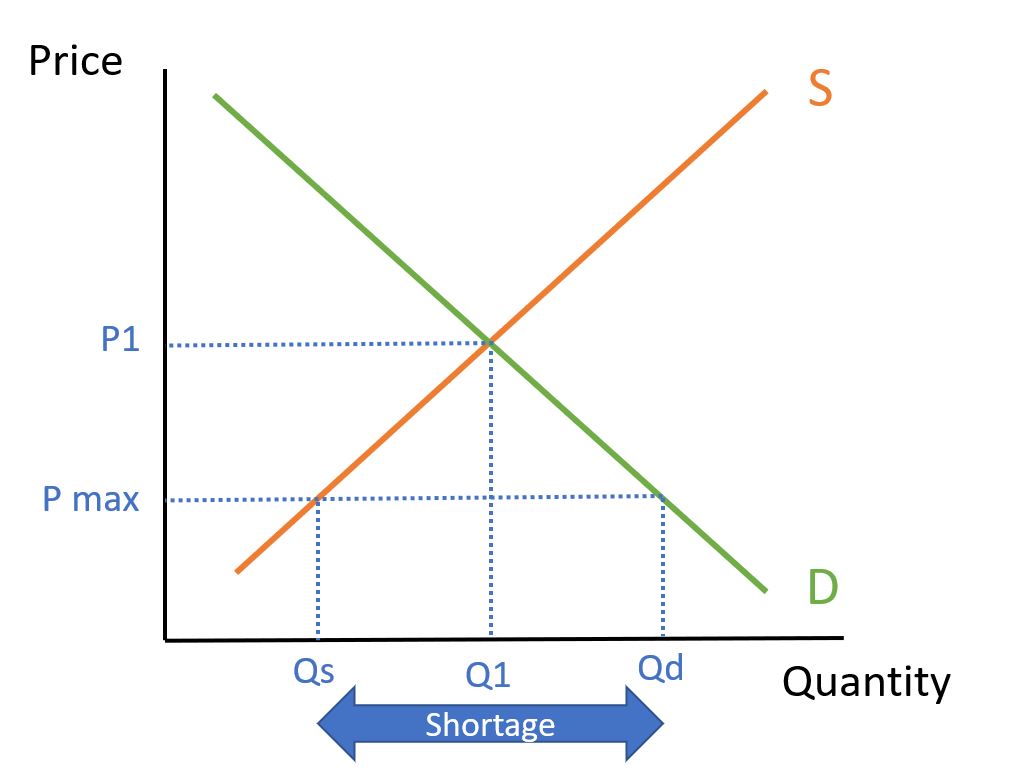
- Use a supply/demand diagram to explain how a maximum price scheme could work (e.g. rent control).
- Explain the benefit of a maximum price scheme, such as rent control.
- What are the benefits of Rent Control?
- What are three disadvantages of Rent Control?
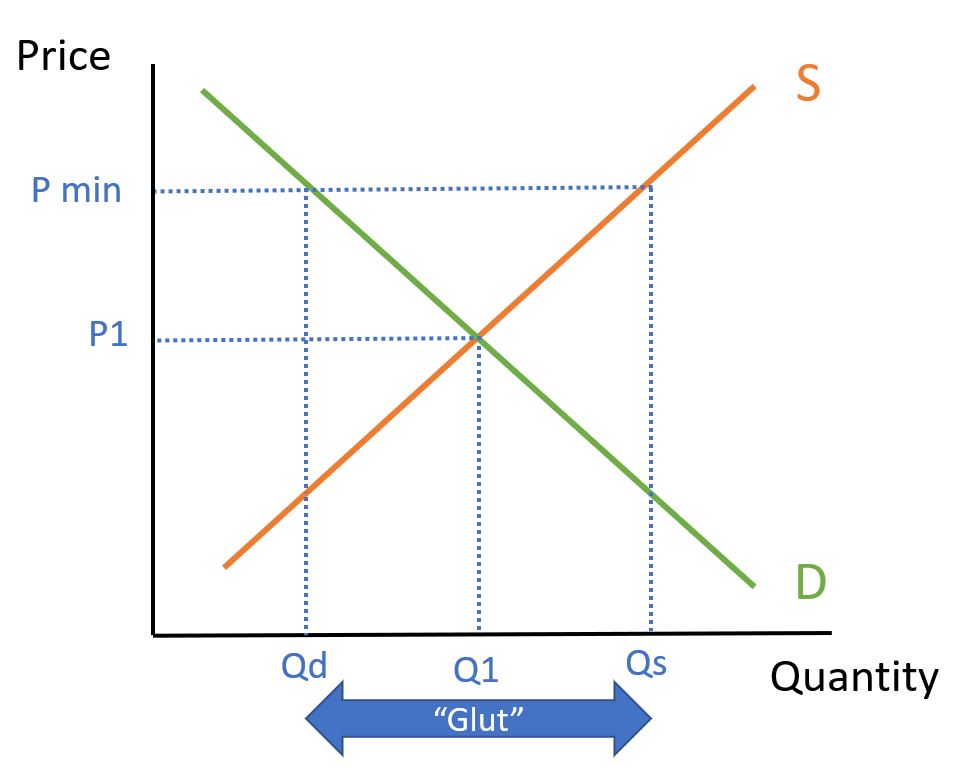
- Use a supply/demand diagram to explain how a minimum price scheme could work (e.g. minimum wage).
- What are two advantages of a Minimum Price scheme?
- What is the disadvantage of a Minimum Price scheme?
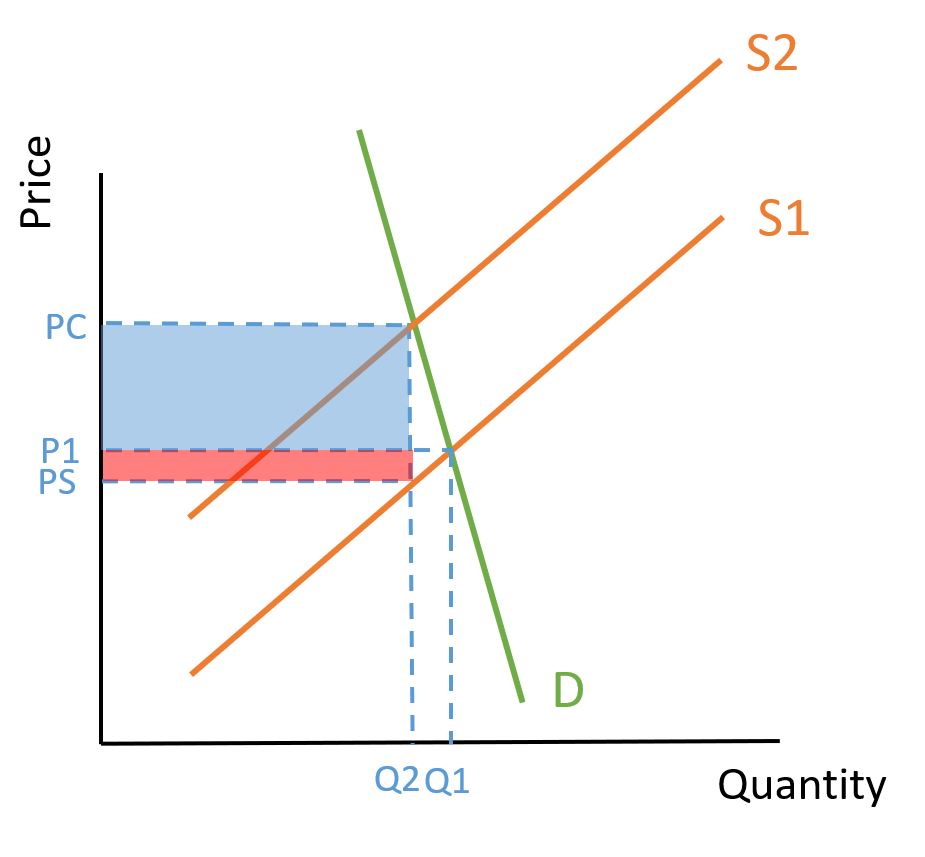
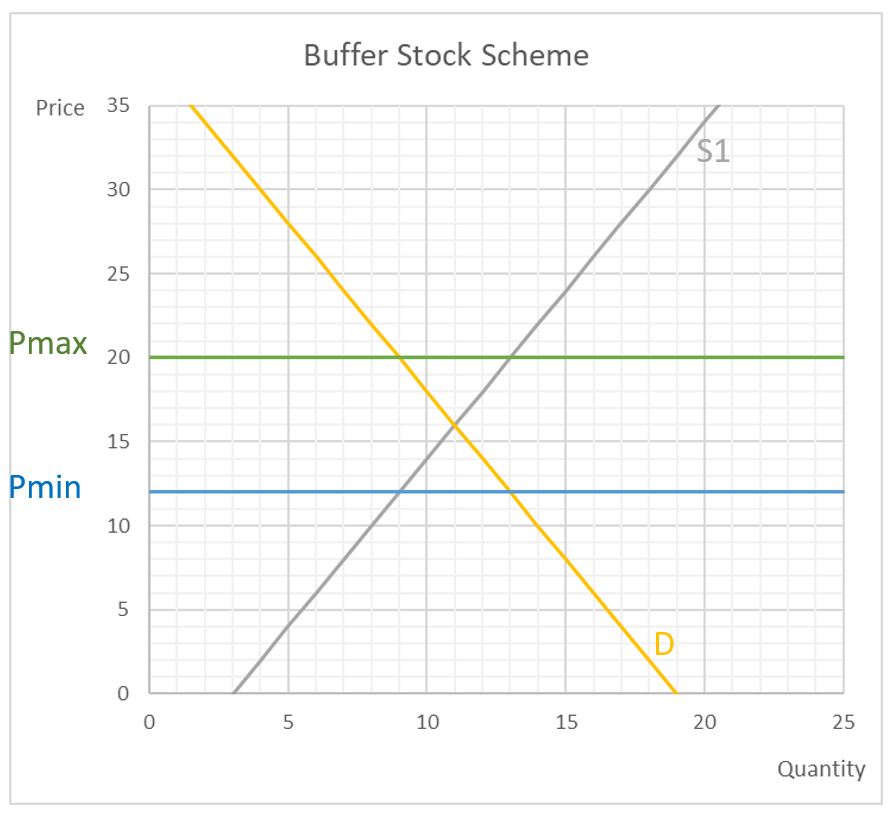
- Draw a supply/demand diagram to show how a Buffer Stock scheme works.
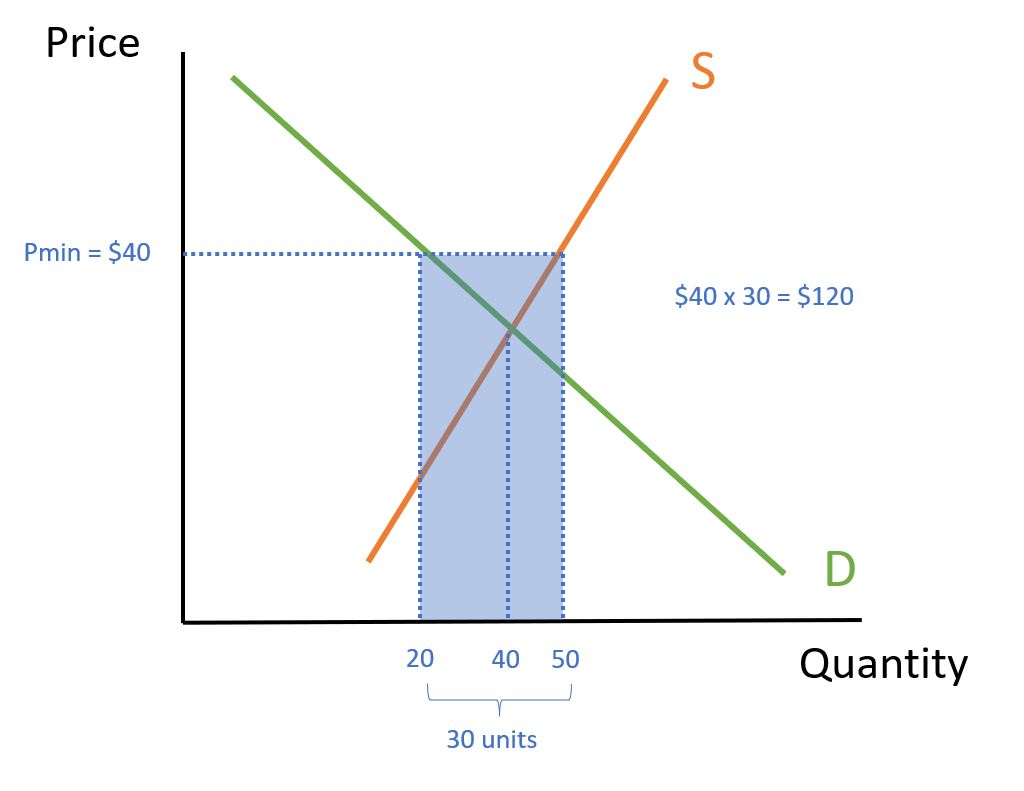
- Use a supply/demand diagram to explain and calculate the cost to the government of maintaining a minimum price with a Buffer Stock Scheme.
- What are two advantages of the government running a Buffer Stock scheme in agriculture?
- What are two disadvantages of the government running a Buffer Stock scheme in agriculture?
- Explain how Tradable Pollution Permits reduce pollution.
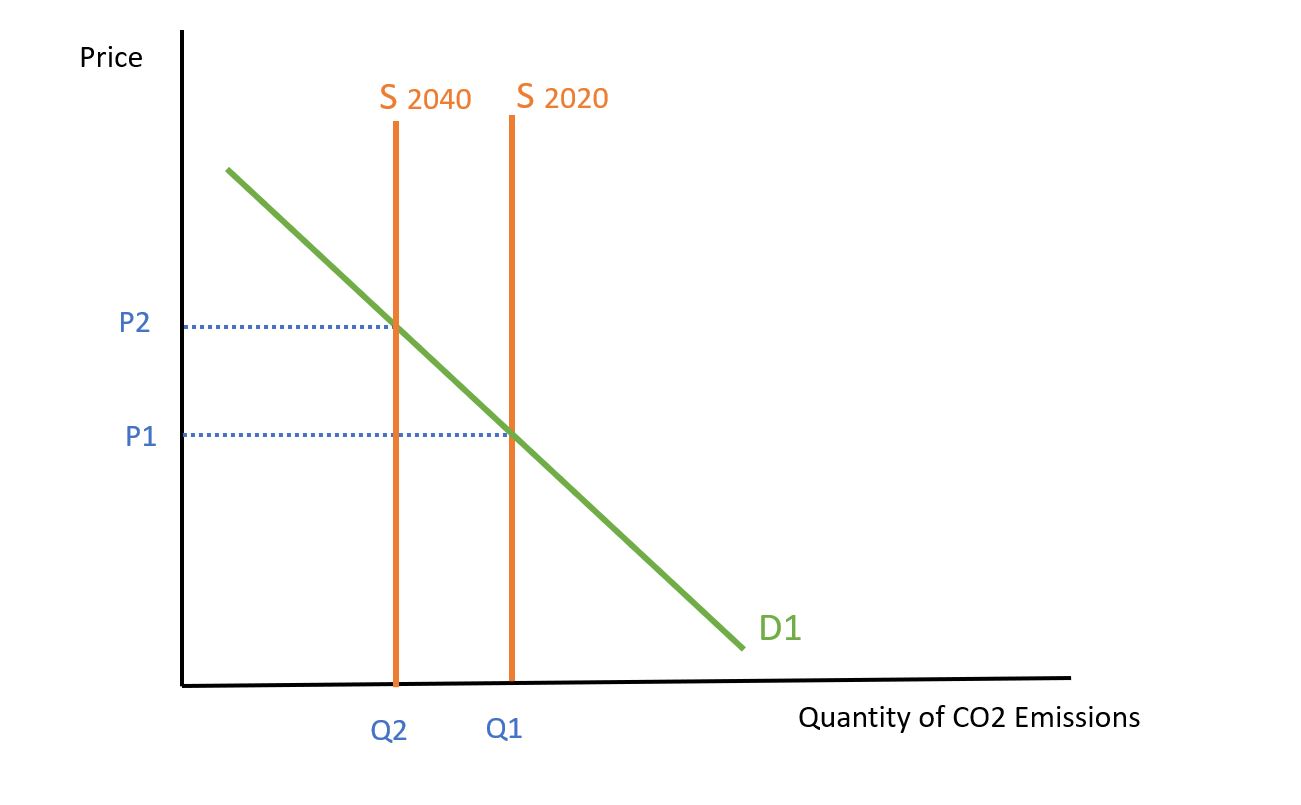
- Draw a supply/demand diagram to show how governments could raise the price of carbon using a TPP scheme.
- What are two benefits of using a Tradable Pollution Permits scheme?
- What are three possible problems of using a Tradable Pollution Permit scheme?
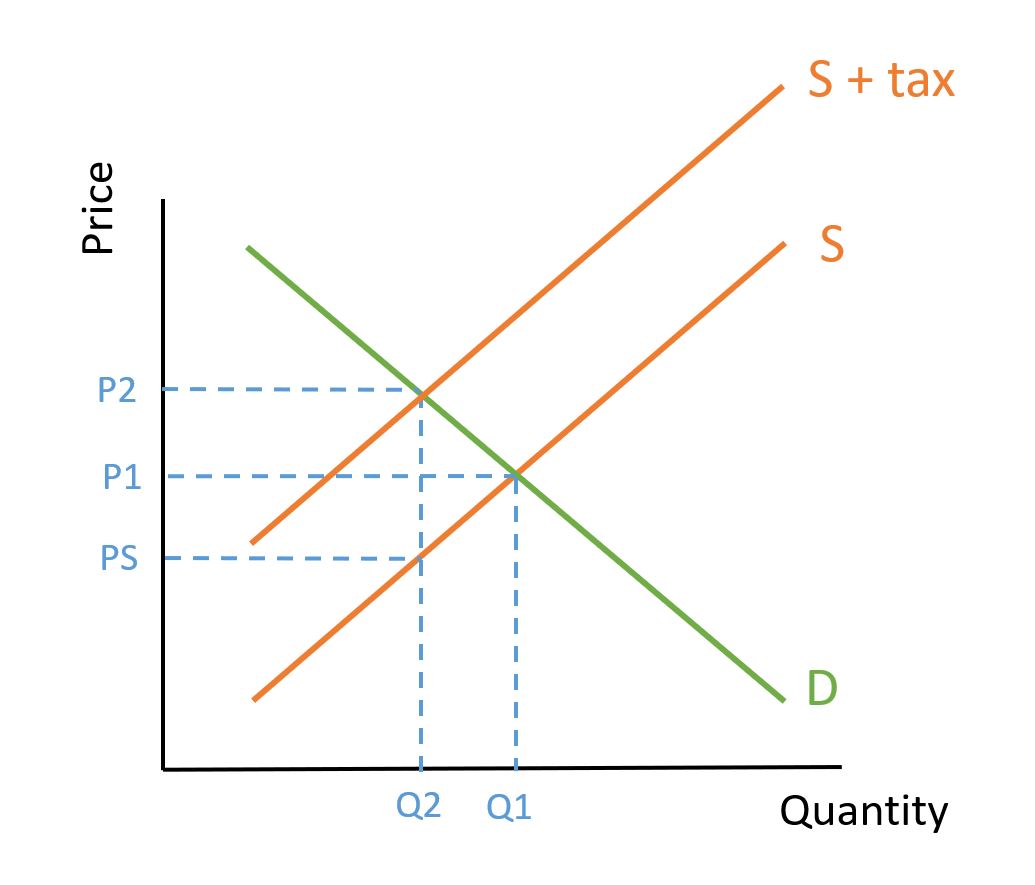
A per-unit tax is paid per unit of production/sale.
A tax on a product at the rate of its price.
By restricting where the good is available to use, or restricting the advertising for the good, demand for the product will shift left and fewer people will use the good.
Making the customer aware of the harmful effects of the product will make them want to consume less. This is particularly relevant for Information Asymmetry.
Mandating usage permits effectively makes a common good excludable (you can't use it if you don't have a permit). This will mean that the usage can be limited to the point where it is not over-used and the tragedy of the commons is avoided.
-Demand for product may be inelastic, so the tax is not effective. -Taxes are regressive if they tax low-income individuals more than high-income individuals (e.g. taxes on smoking). -Estimating the true social cost is more of an art than a science -Taxes are heavy-handed in terms of who is doing the most damage (e.g. the social cost of a moderate drinker is lower than that of a binge drinker) -Governments may just use it as an excuse to generate more revenue . . . and may not hypothecate the tax revenue they have collected.
Tax on a product will shift Supply UP. When demand is inelastic, this does not change the quantity significantly. Consumers pay a high proportion of the new tax revenue (blue area). If the good is primarily consumed by low-income groups, the tax will be regressive.
Pmax is lower than equilibrium price. This means there is Excess Demand at Pmax, causing a shortage. Qs products are produced. Qd-Qs consumers do not get the product.
-Maximum prices ensure that the good is affordable, even to those on low incomes. -It will increase access to important events, such as the London Olympics. -In the case of rental housing, it ensures that the tenants have some balance of power shifted to them in what would otherwise be a lopsided market.
-Provides long-term security for renters -Takes the balance of power away from landlords towards tenants. -Makes the market fairer: low-income households cannot be pushed out when neighbourhood becomes ‘gentrified’ (when new, high-income residents move in)
Any of the following: -Reduces the available supply to the market, through lack of price incentive -Landlords don’t bother to maintain their properties. -Landlords become choosier -Tenants stay in their properties for longer than they would otherwise, restricting available properties for newcomers. -Rent-controlled properties often go to those on higher incomes, as they have the means to track down the cheaper apartments.
Pmin is higher than equilibrium price. This means there is Excess Supply at Pmin, causing a 'glut'. Qs products are produced, but only Qd products are purchased by consumers.
-Ensures sellers make enough for their product (e.g. low-income farmers in Thailand have stable income) -Could help solve poverty (e.g. minimum wage).
The excess supply (or ‘glut’) that results is wasteful (e.g. Thai government’s spending on the ‘rice mountain’)
The government sets two prices: Pmax and Pmin If the market price goes above/below these prices, the government intervenes by selling from/adding to the buffer stock.
If equilibrium price falls below Pmin, there will be Excess Supply. The government must purchase all excess supply at Pmin. The government will need to pay (Qs-Qd) X Pmin, i.e. 30 x $40 = $120
Any of the following: -Rural living standards will be higher -Farmers will be able to invest -Prices have been stabilised giving greater certainty over the future. -Food supply should be guaranteed
Any of the following: -Buffer stock scheme is expensive. -It distorts incentives for production and consumption- resource allocation is distorted. -Improvements in farming technology will continue to increase supply . . . costing ever more money. -Greater price stability attracts more producers . . . further increasing supply. -Easily open to political interference, to benefit those loyal to government (e.g. Thailand)
Government sets a cap on level of pollution allowed. Firms have permits to allow them to pollute. They can either use the permits or reduce their emissions and sell them to other firms. This creates a monetary incentive for firms to reduce their pollution. Reducing the number or permits over time increases the price of pollution- further incentivising cuts.
-Creates a market incentive for innovation to cut carbon. -Efficient because it is cost effective: carbon emissions can be cut by the firms who have the cheapest costs.
Any of the following: -Carbon prices have been too low to act as an incentive. -Fines for breaking the rules have been too low to be effective. -Measurement problems/cheating/enforcement issues. -“Carbon Leakage”: Production shifts from regulated to unregulated markets. -Must be a global system to be effective . . . including China.
1.7.3 The effects of government intervention
- What are common examples of Government Failure?
- Define Government Failure
- What are common reasons for Government Failure to occur?
- What is 'Moral Hazard'?
- What is 'Regulatory Capture'?
-Chinese Sparrow Campaign -War on drugs- only leading to violence in Central America -Road warning signs leading to higher accident rates -Prohibition of Alcohol in the USA -Tax on rubbish leading to fly tipping -Common Agricultural Policy: Minimum price caused too much production
When government intervention in the economy causes an inefficient allocation of resources and a decline in economic welfare.
Any of the following: -Government Inefficiency (Distorted price signals, Lack of Incentives, Political Interference, Inadequate Information) -Unintended consequences -Moral Hazard -Regulatory Capture
When intervention to reduce risk-taking behaviour encourages the risk-taking behaviour it is meant to prevent. e.g. A policy of bailing out failing banks means banks take more risks, increasing the likelihood they will need bailing out.
When industry regulators are overly-influenced by the industry they are meant to regulate. e.g. Boeing is too powerful with the FAA, which led to the 737 Max flying even though it was unsafe