Knowledge Organiser
1.5.1 Costs, revenues and profits
- What does marginal mean?
- What does total mean?
- What does average mean?
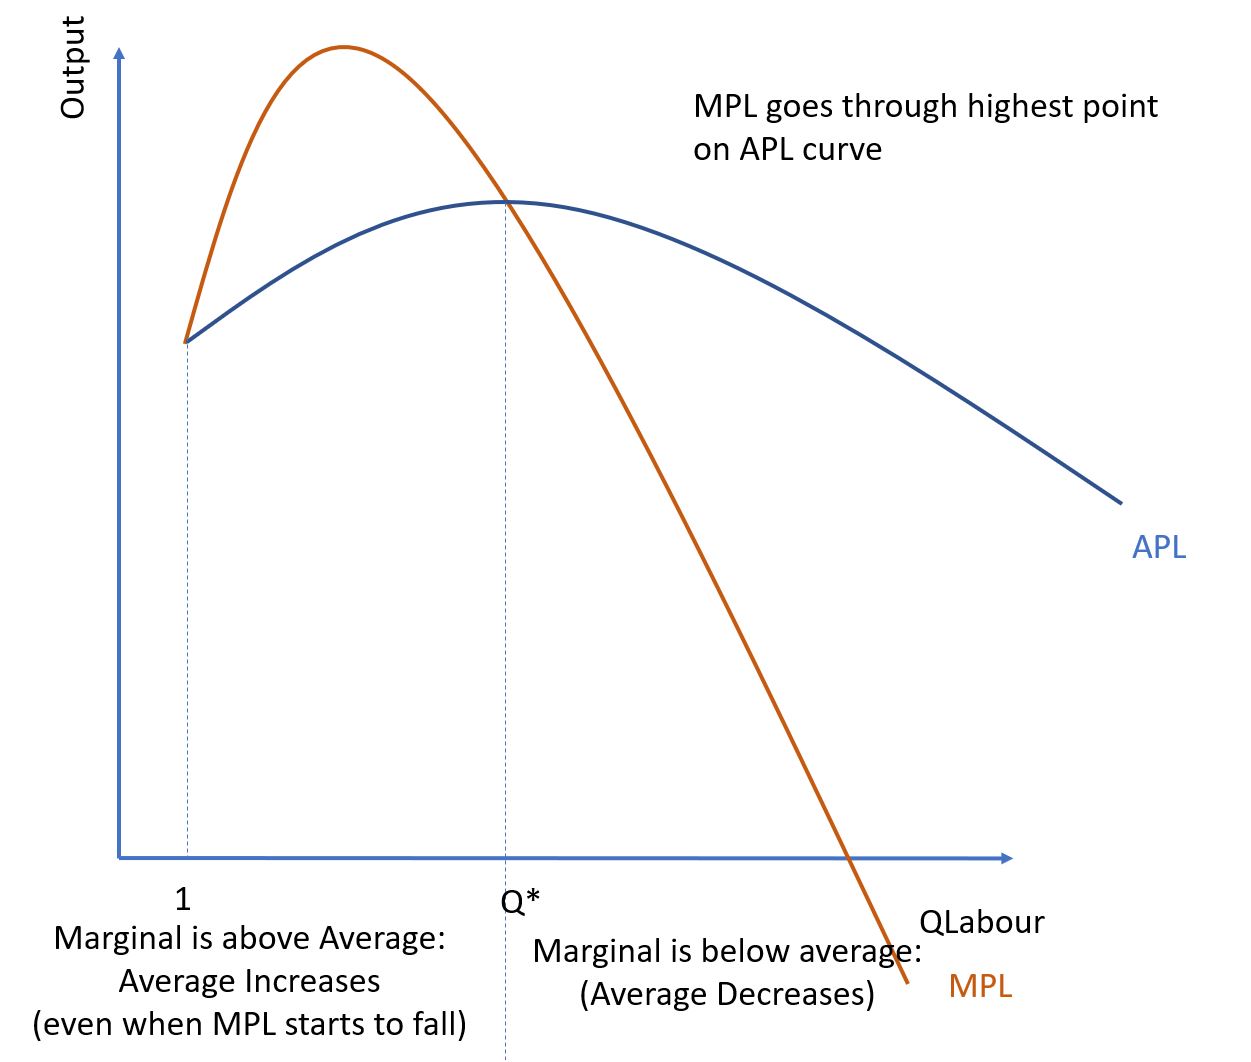
- Whenever Marginal is below Average, Average will . . .
- Whenever Marginal is above Average, Average will . . .
- Define short run
- Define long run
- Define fixed costs.
- Define variable costs.
- List some examples of Fixed Costs
- List some examples of Variable Costs
- Why might fixed costs change?
- Total Costs =
- Average Total Cost (ATC/AC) =
- Why do we get increasing returns to the variable factor?
- Why do we get diminishing returns to the variable factor?
- Why do we get negative returns to the variable factor?
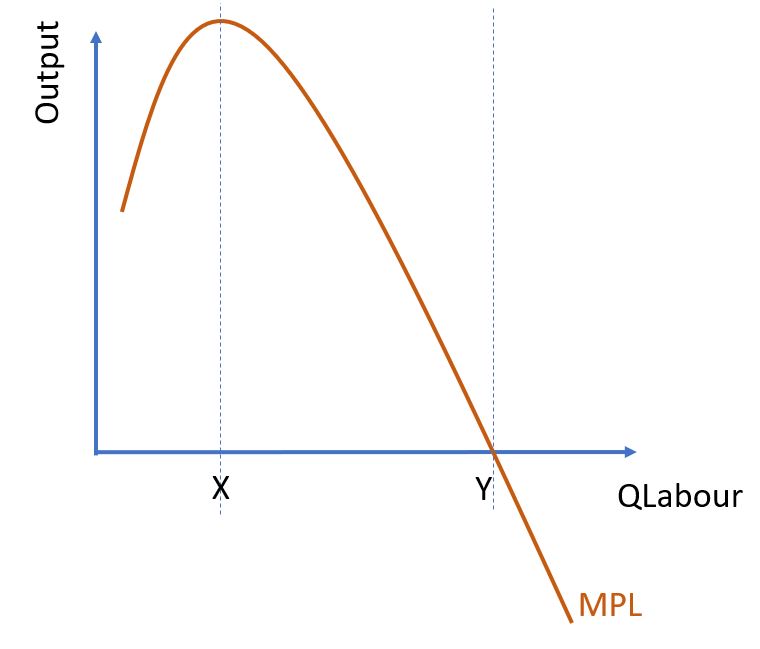
- Draw the Marginal Product of Labour curve.
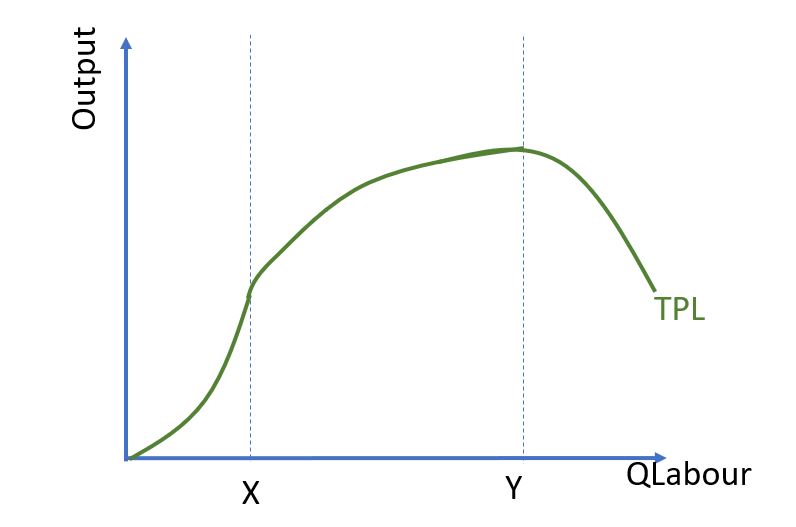
- Draw the Total Product of Labour curve.
- Draw the Average Product of Labour Curve (with Marginal Product of Labour as well for reference)
- If the Marginal curve is Positive, Sloping Down, then the Total curve will be . . .
- If the Marginal curve is Positive, Sloping Up, then the Total curve will be . . .
- If the Marginal curve is Negative, then the Total curve will be . . .
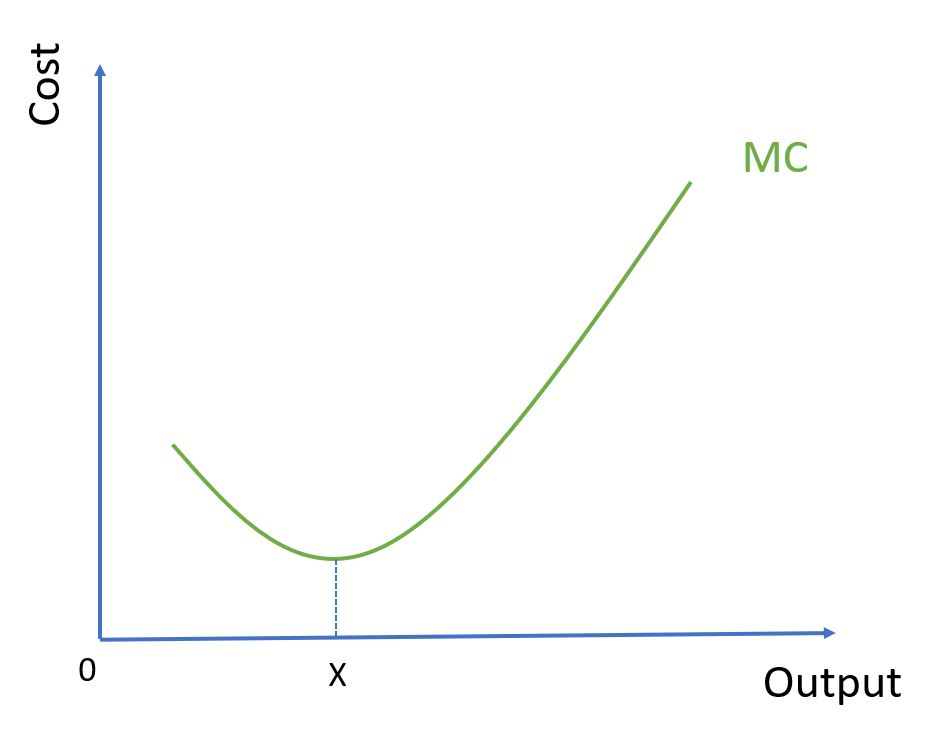
- What does the Marginal Cost (MC) curve represent?
- Draw the Marginal Cost (MC) curve and identify where there are increasing and diminishing returns to the variable factor.
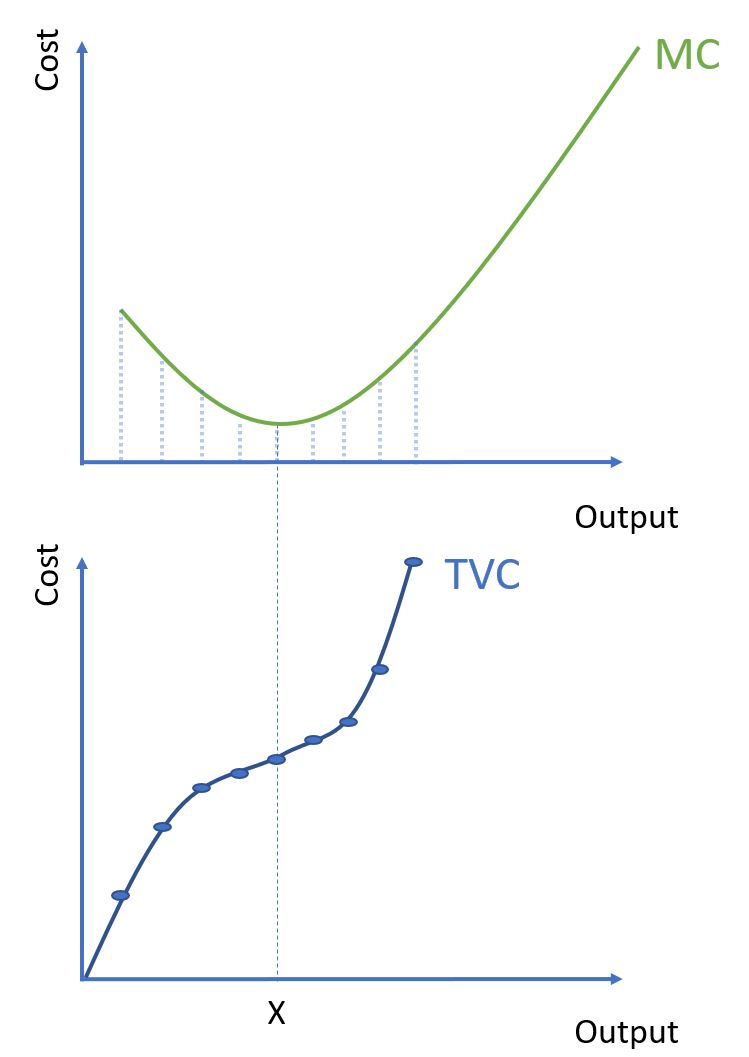
- What is the relationship between Total Variable Cost (TVC) and Marginal Cost (MC)?
- Draw the MC curve on top of the TVC curve, showing the relationship between the two.
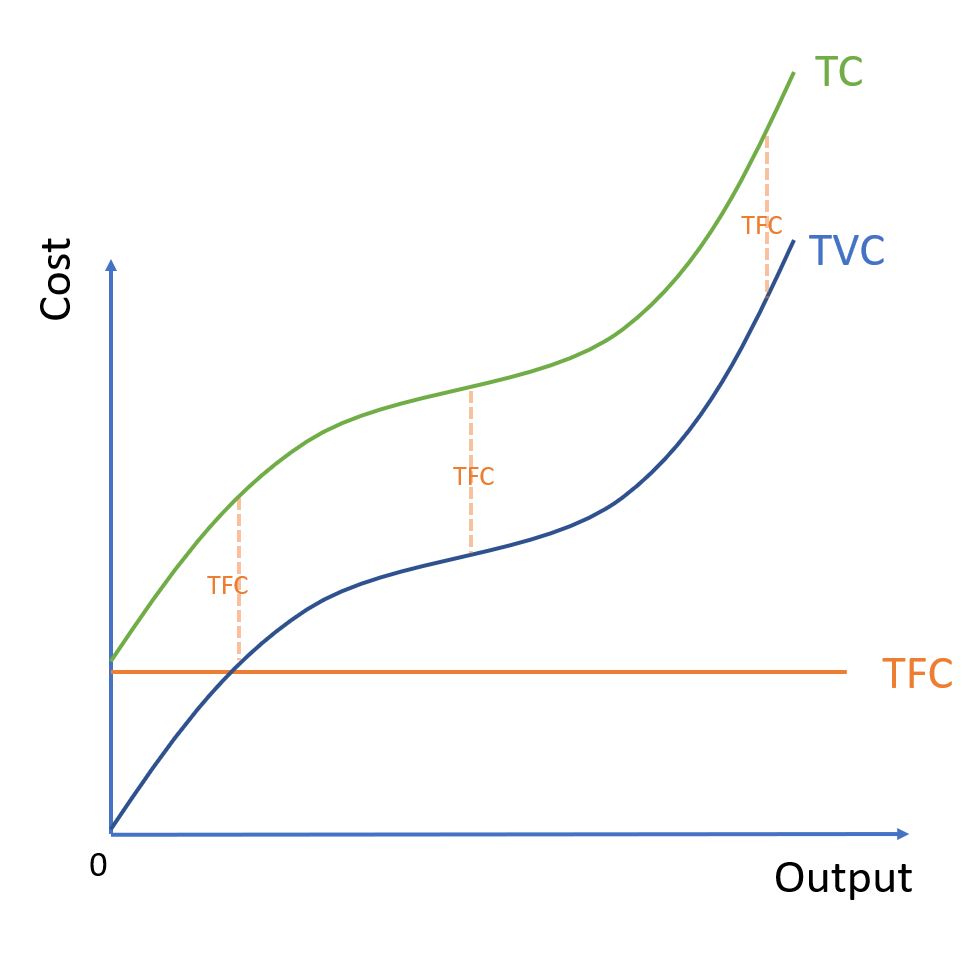
- Draw the TVC, TFC, and TC curves on the correct axes.
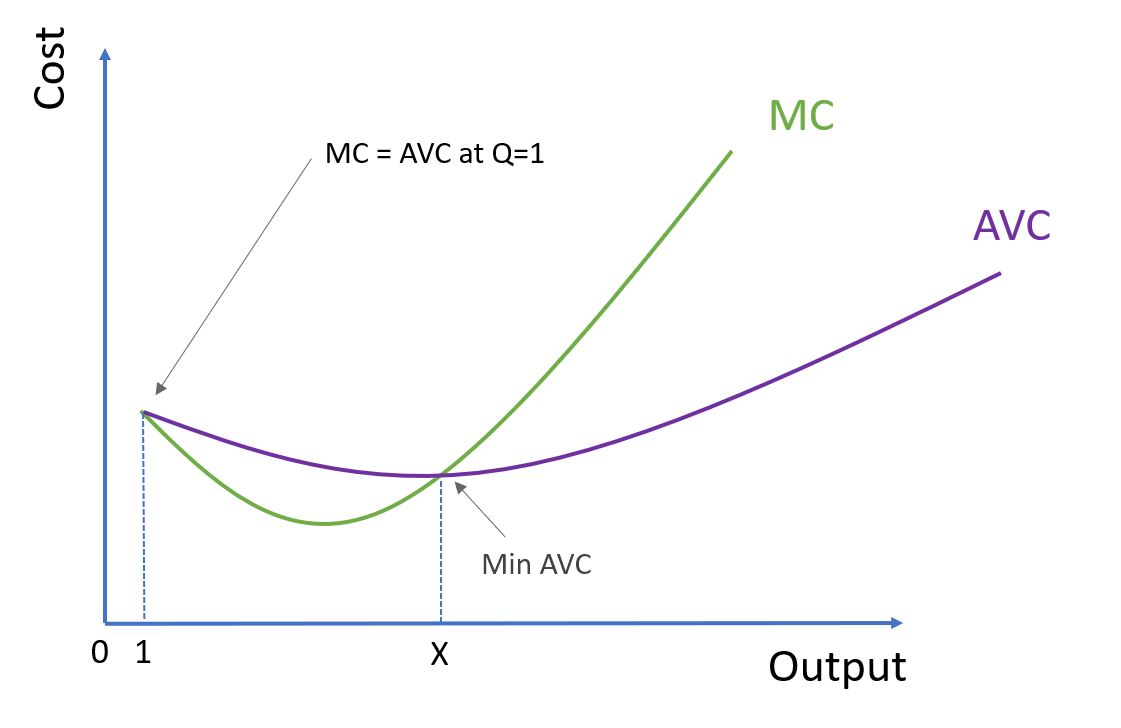
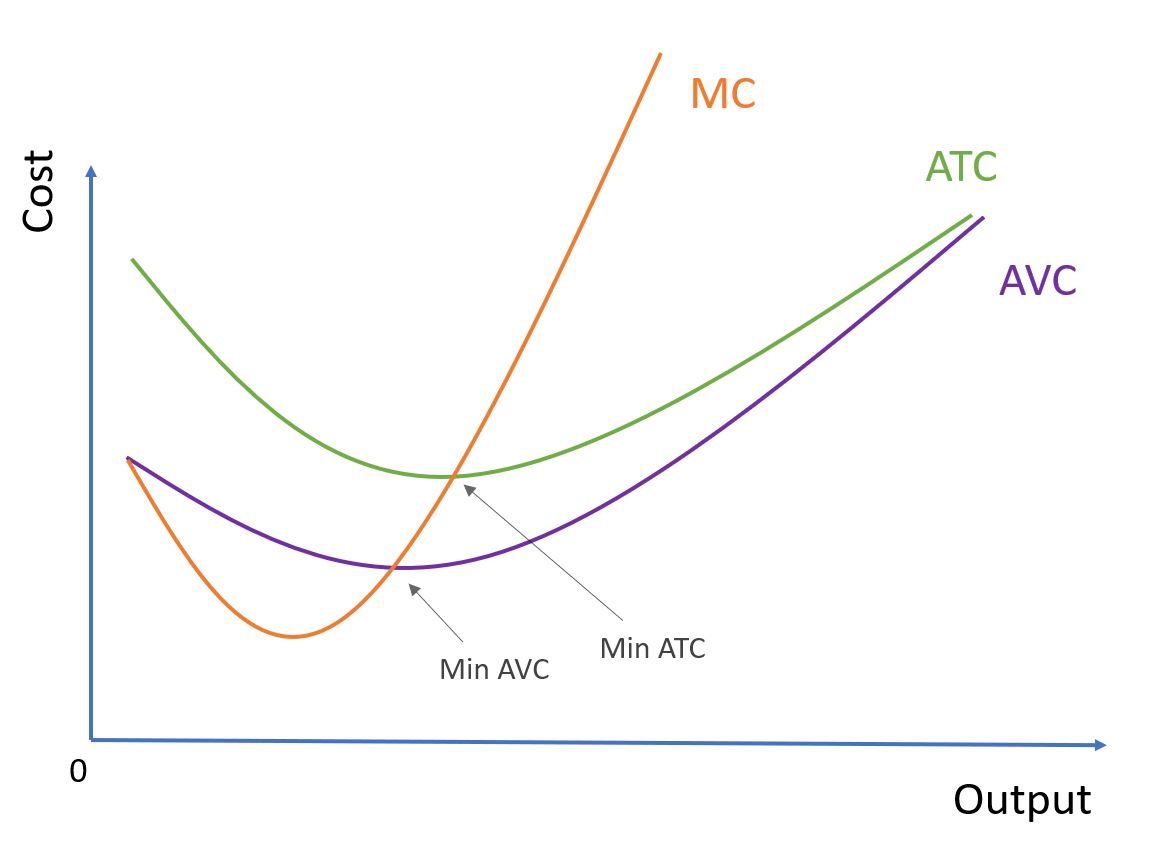
- Draw the AVC and MC curves, with care to show what happens at output=1 and when MC = AVC.
- Draw the TFC and AFC curves, with care to show what happens at output=1.
- Why does the Average Fixed Cost (AFC) curve approach 0?
- Draw the ATC, AVC, and AFC Curves
- Why does ATC curve approach the AVC curve?
- Draw the MC, ATC, and AVC curves on one diagram, taking care to show the relationship between MC and the other curves
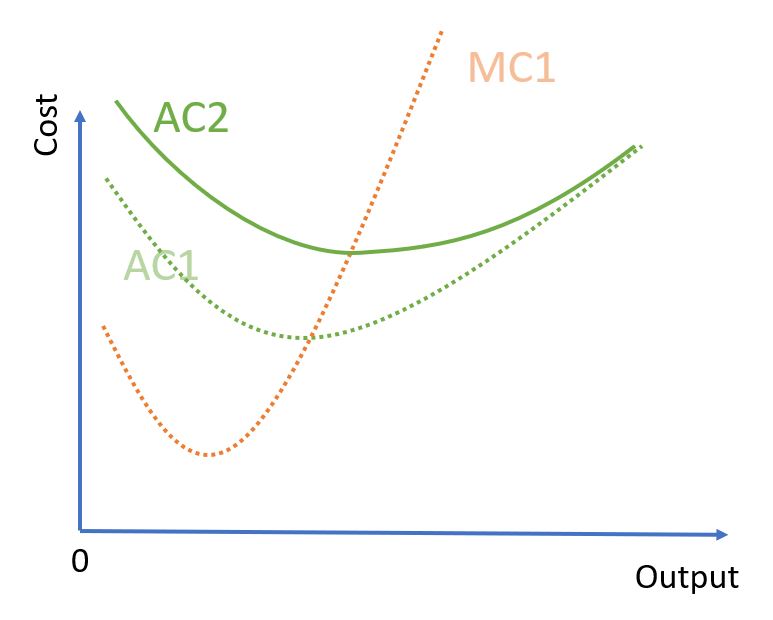
- Draw a diagram to show what will happen to AC and MC following an increase in Variable Costs
- Draw a diagram to show what will happen to AC and MC following an increase in Fixed Costs
- Define Accounting Profit
- Define Economic Profit
- Define Normal Profit in three ways.
- Define Abnormal Profit in three ways.
- What is implied when Economic Profit = 0?
- Where is Profit Maximised?
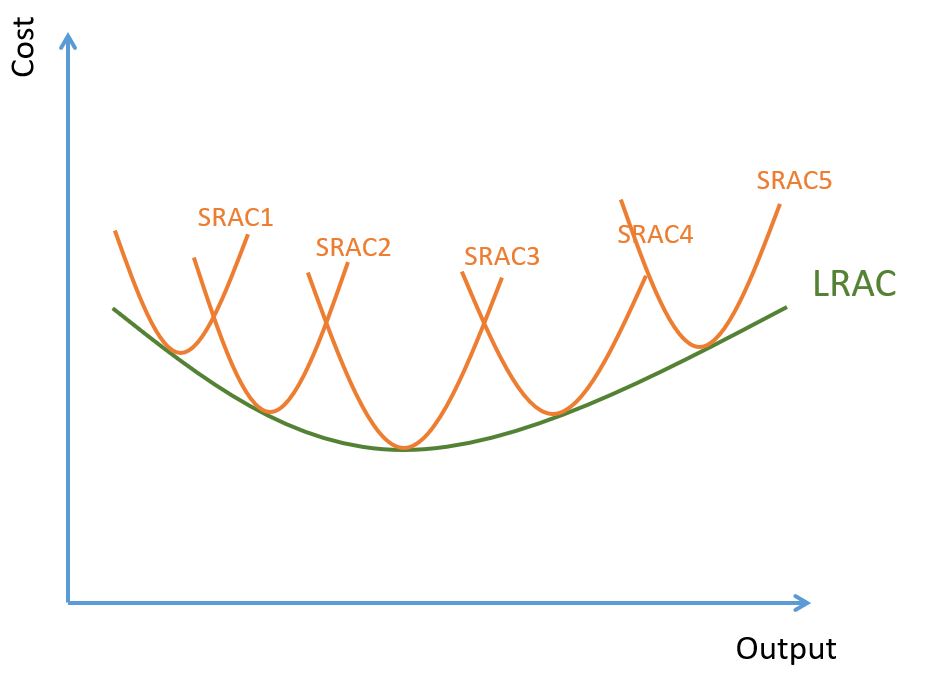
- Draw the LRAC as an envelope curve of SRACs
- Draw an LRAC curve and label Economies of Scale, Diseconomies of Scale, and Minimum Efficient Scale.
- Define Economies of Scale
- Define Diseconomies of Scale
- List at least three (3) examples of Economies of Scale
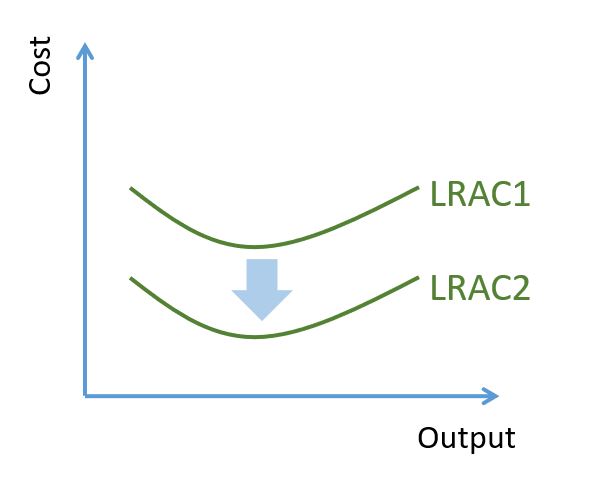
- Define External Economies of Scale
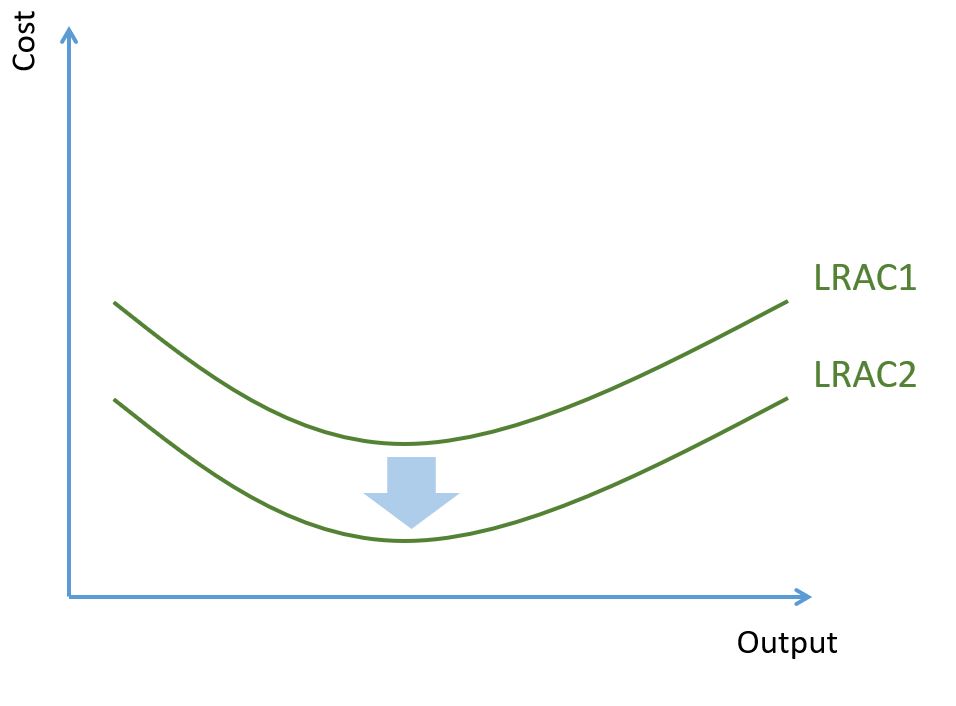
- Draw a diagram to show External Economies of Scale
The additional __________ from producing one extra unit.
Add all the __________ together.
Add all the __________ and divide by the number of units sold
. . . decrease
. . . increase
The period of time in which at least one fixed factor of production (usually capital) is fixed.
The period of time in which all factors of production (including capital) are variable.
Costs that do not change as output rises.
Costs that change directly with output.
examples: - Rent - Equipment Leases - Basic Utilities - Advertising - Administration - Loan Interest
examples: - Raw materials - Direct Labour - Power used in manufacturing
Fixed costs will change if an external factor (other than output) changes. For example: your rent could change from year to year.
Fixed Costs + Variable Costs
Average Fixed Costs (AFC) + Average Variable Costs (AVC)
At low quantity of labour, as more workers are added the marginal product of labour increases. This is because of division of labour and teamwork.
At medium quantity of labour, as more workers are added the marginal product of labour decreases. This is because the opportunities for specialisation have passed and workers are likely to get in each other's way.
At high quantity of labour, as more workers are added the marginal product of labour becomes negative. This is because the extra workers are all getting in the way and actually lead to lower output levels.
. . . Increasing at an ever-decreasing rate
. . . Increasing at an ever-increasing rate
. . . Decreasing
-Extra cost -Individual Cost -Change in total cost from making one more unit.
From 0 to X: Increasing Returns to the Variable Factor (teamwork) After X: Diminishing returns to the variable factor.
TVC = sum of all MCs

As output increases Fixed Cost is constant, divided by an ever-increasing number. AFC will constantly decrease, approaching (but never reaching) 0.
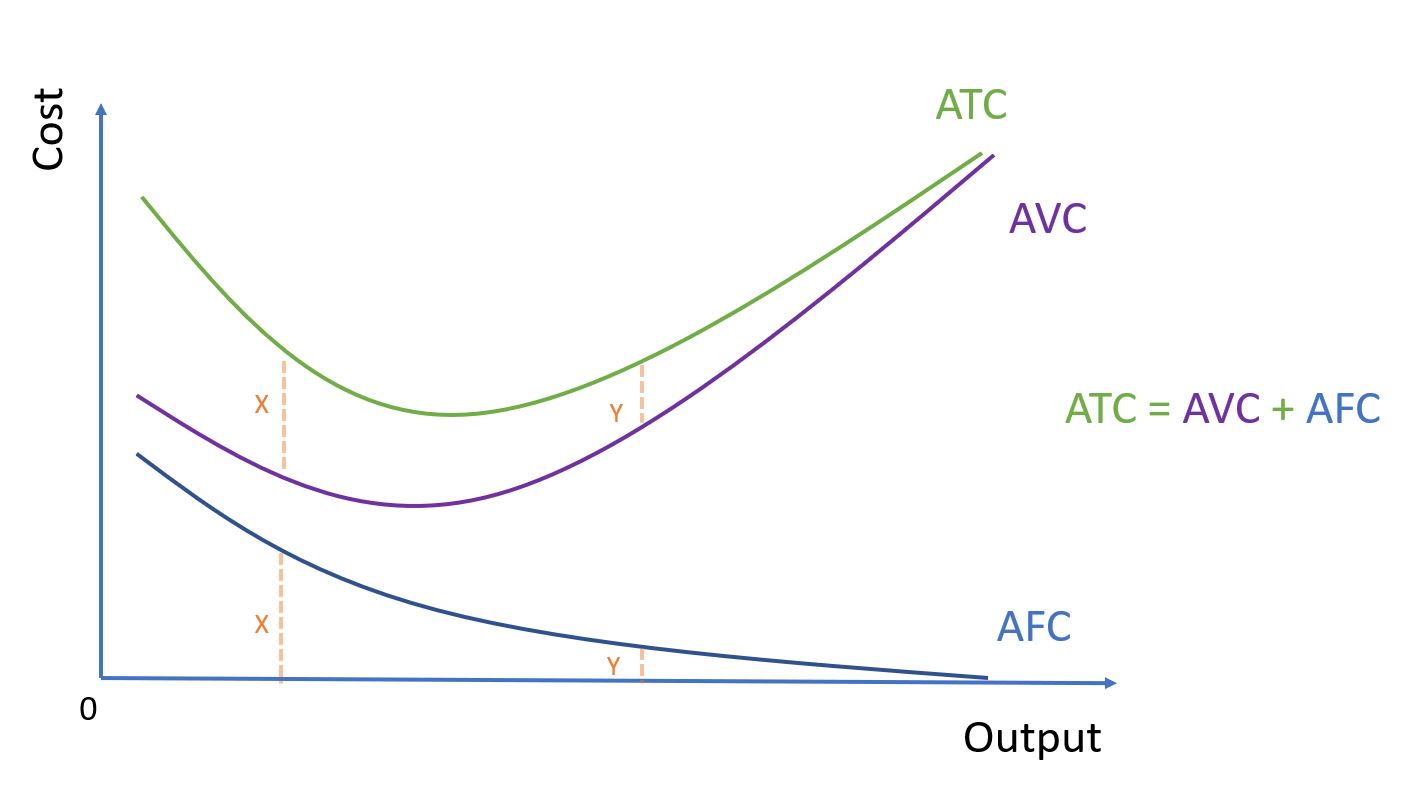
→ ATC = AVC + AFC → AFC slowly approaches 0 as output increases → ATC is very nearly AVC as output increases.
Both MC and AC have a vertical shift upwards

Only AC changes AC pivots upwards
Accounting profit = Revenue - Total Costs (not including opportunity costs)
Economic Profit is profit above our opportunity cost of production (i.e. covering your opportunity cost and then some)
→ The profit level necessary for firms to stay in the industry in the Long Run. → You only cover your opportunity costs (and no more). → Economic Profit = 0
→ Profit above normal profit. → You cover your opportunity cost and then some. → Economic Profit is positive.
Revenue - Costs = Opportunity Cost (i.e. You are only covering your opportunity cost; no more) You are making Normal Profit
MC = MR

Occurs when an increase in production results in lower long-run average costs.
Occurs when an increase in production results in higher long-run average costs.
-Managerial Economies of Scale -Financial Economies of Scale -Risk-Bearing Economies of Scale -Marketing Economies of Scale -Purchasing Economies of Scale -External Economies of Scale
When the growth of the entire industry leads to falls in Average Costs for all companies in the industry. Also applies to when a firm is in an area of growth or high population, leading to infrastructure that leads to its own costs falling.
1.5.2 The growth of firms
- What is the difference between organic growth and inorganic growth?
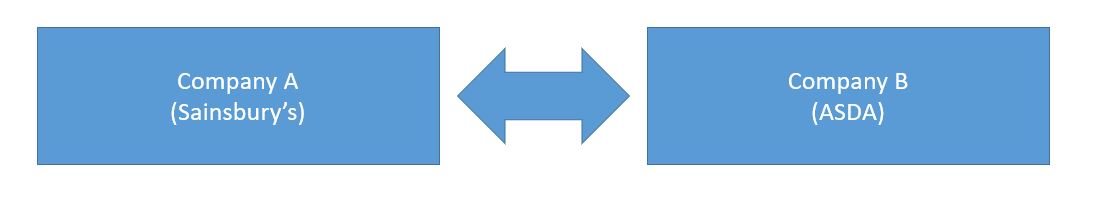
- Define Horizontal Integration
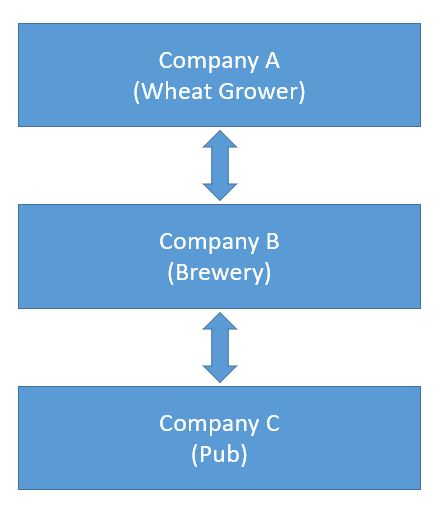
- Define Vertical Integration
- Define Conglomerate Integration
- What is an example of Horizontal Integration?
- What is an example of Vertical Integration?
- What are the advantages/disadvantages of Horizontal Integration?
- What are the advantages/disadvantages of Vertical Integration?
- What are the advantages/disadvantages of Conglomerate Integration?
- What are some common disadvantages of all types of integration?
-Organic growth occurs from the firm reinvesting profits and expanding sales. -Inorganic growth occurs when a firm merges and takes over other firms.
→ Same industry → Same stage of production
→ Same industry → Different stages of production
→ Different industries → Different stages of production
examples: -Asda/Sainsburys Merger
examples: -Wheat Grower/Brewery/Pub
Advantages: ◦ Increased market share → Monopoly Power → Higher prices ◦ Economies of Scale → Lower costs Disadvantages: ◦ Possible diseconomies of scale
Advantages: ◦ Control over suppliers gives: ∙Lower costs ∙Control quality ∙Limits access to competitors (behavioural barrier to entry) ◦ Control over distribution gives: ∙Higher profit margins ∙Control over how the product is sold Disadvantages: ◦ Lack of experience in the new stage of production.
Advantages: ◦ Diversification of product offering → Less risk if demand for your product decreases. ◦ Chance to find new ‘synergies’ across industries, e.g. finding new ways to connect diverse products. Disadvantages: ◦ Lack of experience in new industry.
◦ Potential clash of cultures. ◦ Costly and timely to reap full benefits.
1.5.3 Efficiency
- Define Allocative Efficiency in 3 ways.
- Describe Allocative Efficiency.
- Define Productive Efficiency in 2 ways.
- Define Dynamic Efficiency
- Give a real-world example of dynamic efficiency.
- Define X-inefficiency
- Give two examples of businesses which are likely to be X-inefficient.
→ P = MC → Supply = Demand → Society Welfare is Maximised
Every consumer who values the product above the Marginal Cost of production is able to purchase the product.
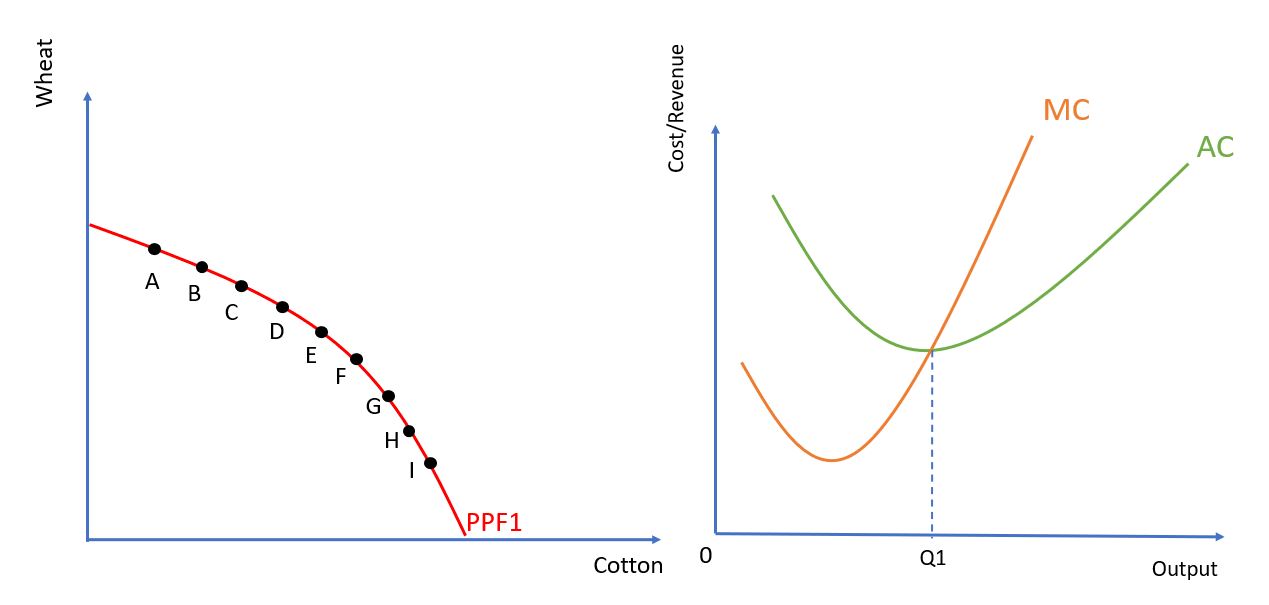
→ Producing on the PPF boundary → Producing where AC is minimised
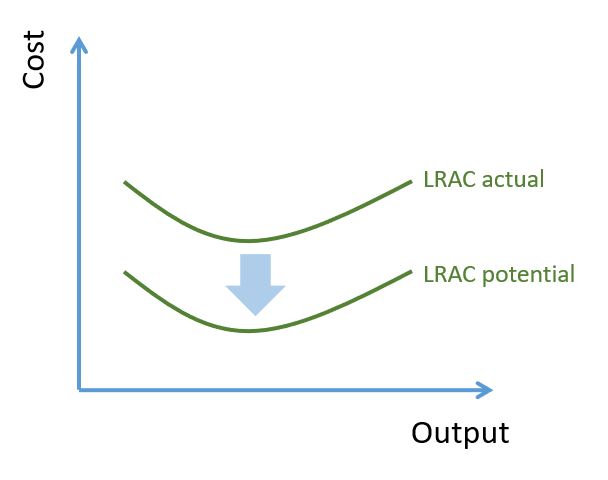
Firms driving down their LR costs in the Long Run by re-investing abnormal profits
Computer hard drives have decreased in price over 30 years. Amazon re-invests its profits to create new efficiencies in its delivery service.
The tendency of incumbent firms to not look for ways to make themselves as efficient as they could possibly be through laziness or complacency.
→ Monopolies → Government bureaucracies