2.1.8 Phillips Curve: Historical Investigation
Study the data in the chart below:
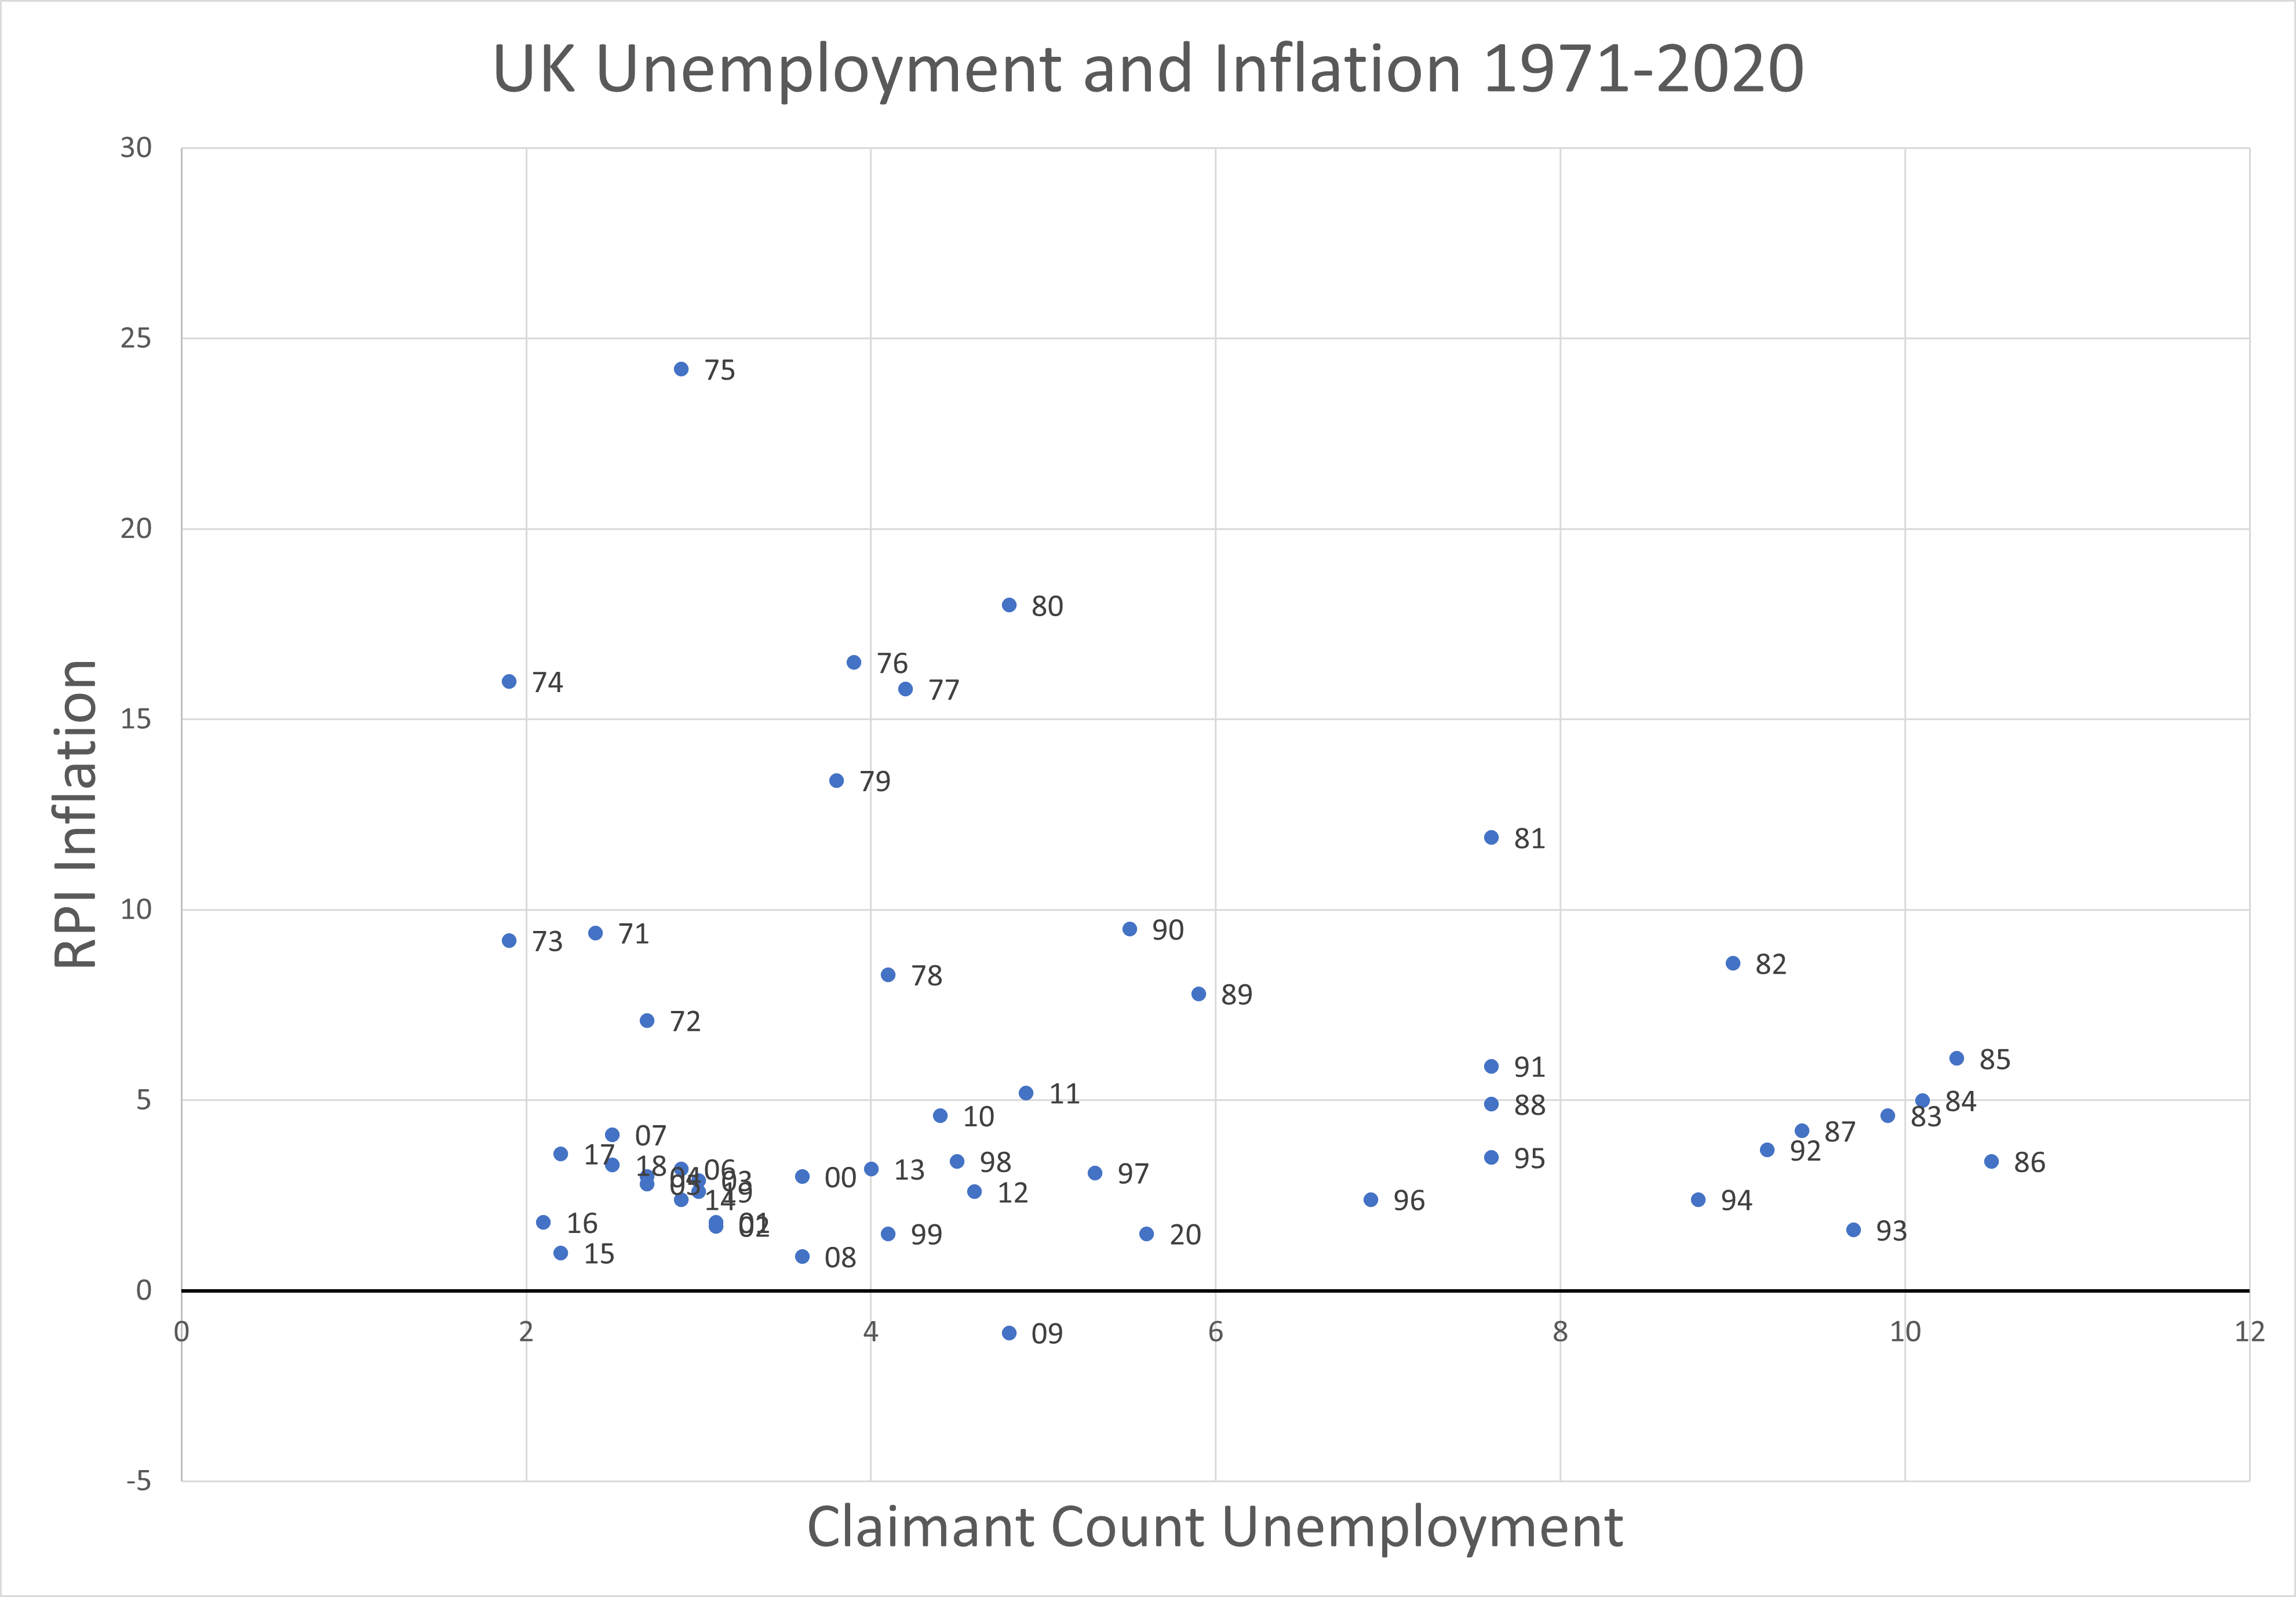
- Describe the trends in the data shown.
- Does there appear to be any relationship between inflation and unemployment?
After you have answered these questions, click through the panels below to investigate different time periods in further depth.
- Identify four periods in which there appeared to be Phillips Curve relationship.
- What could have caused the economy to switch from one Phillips Curve to the next?
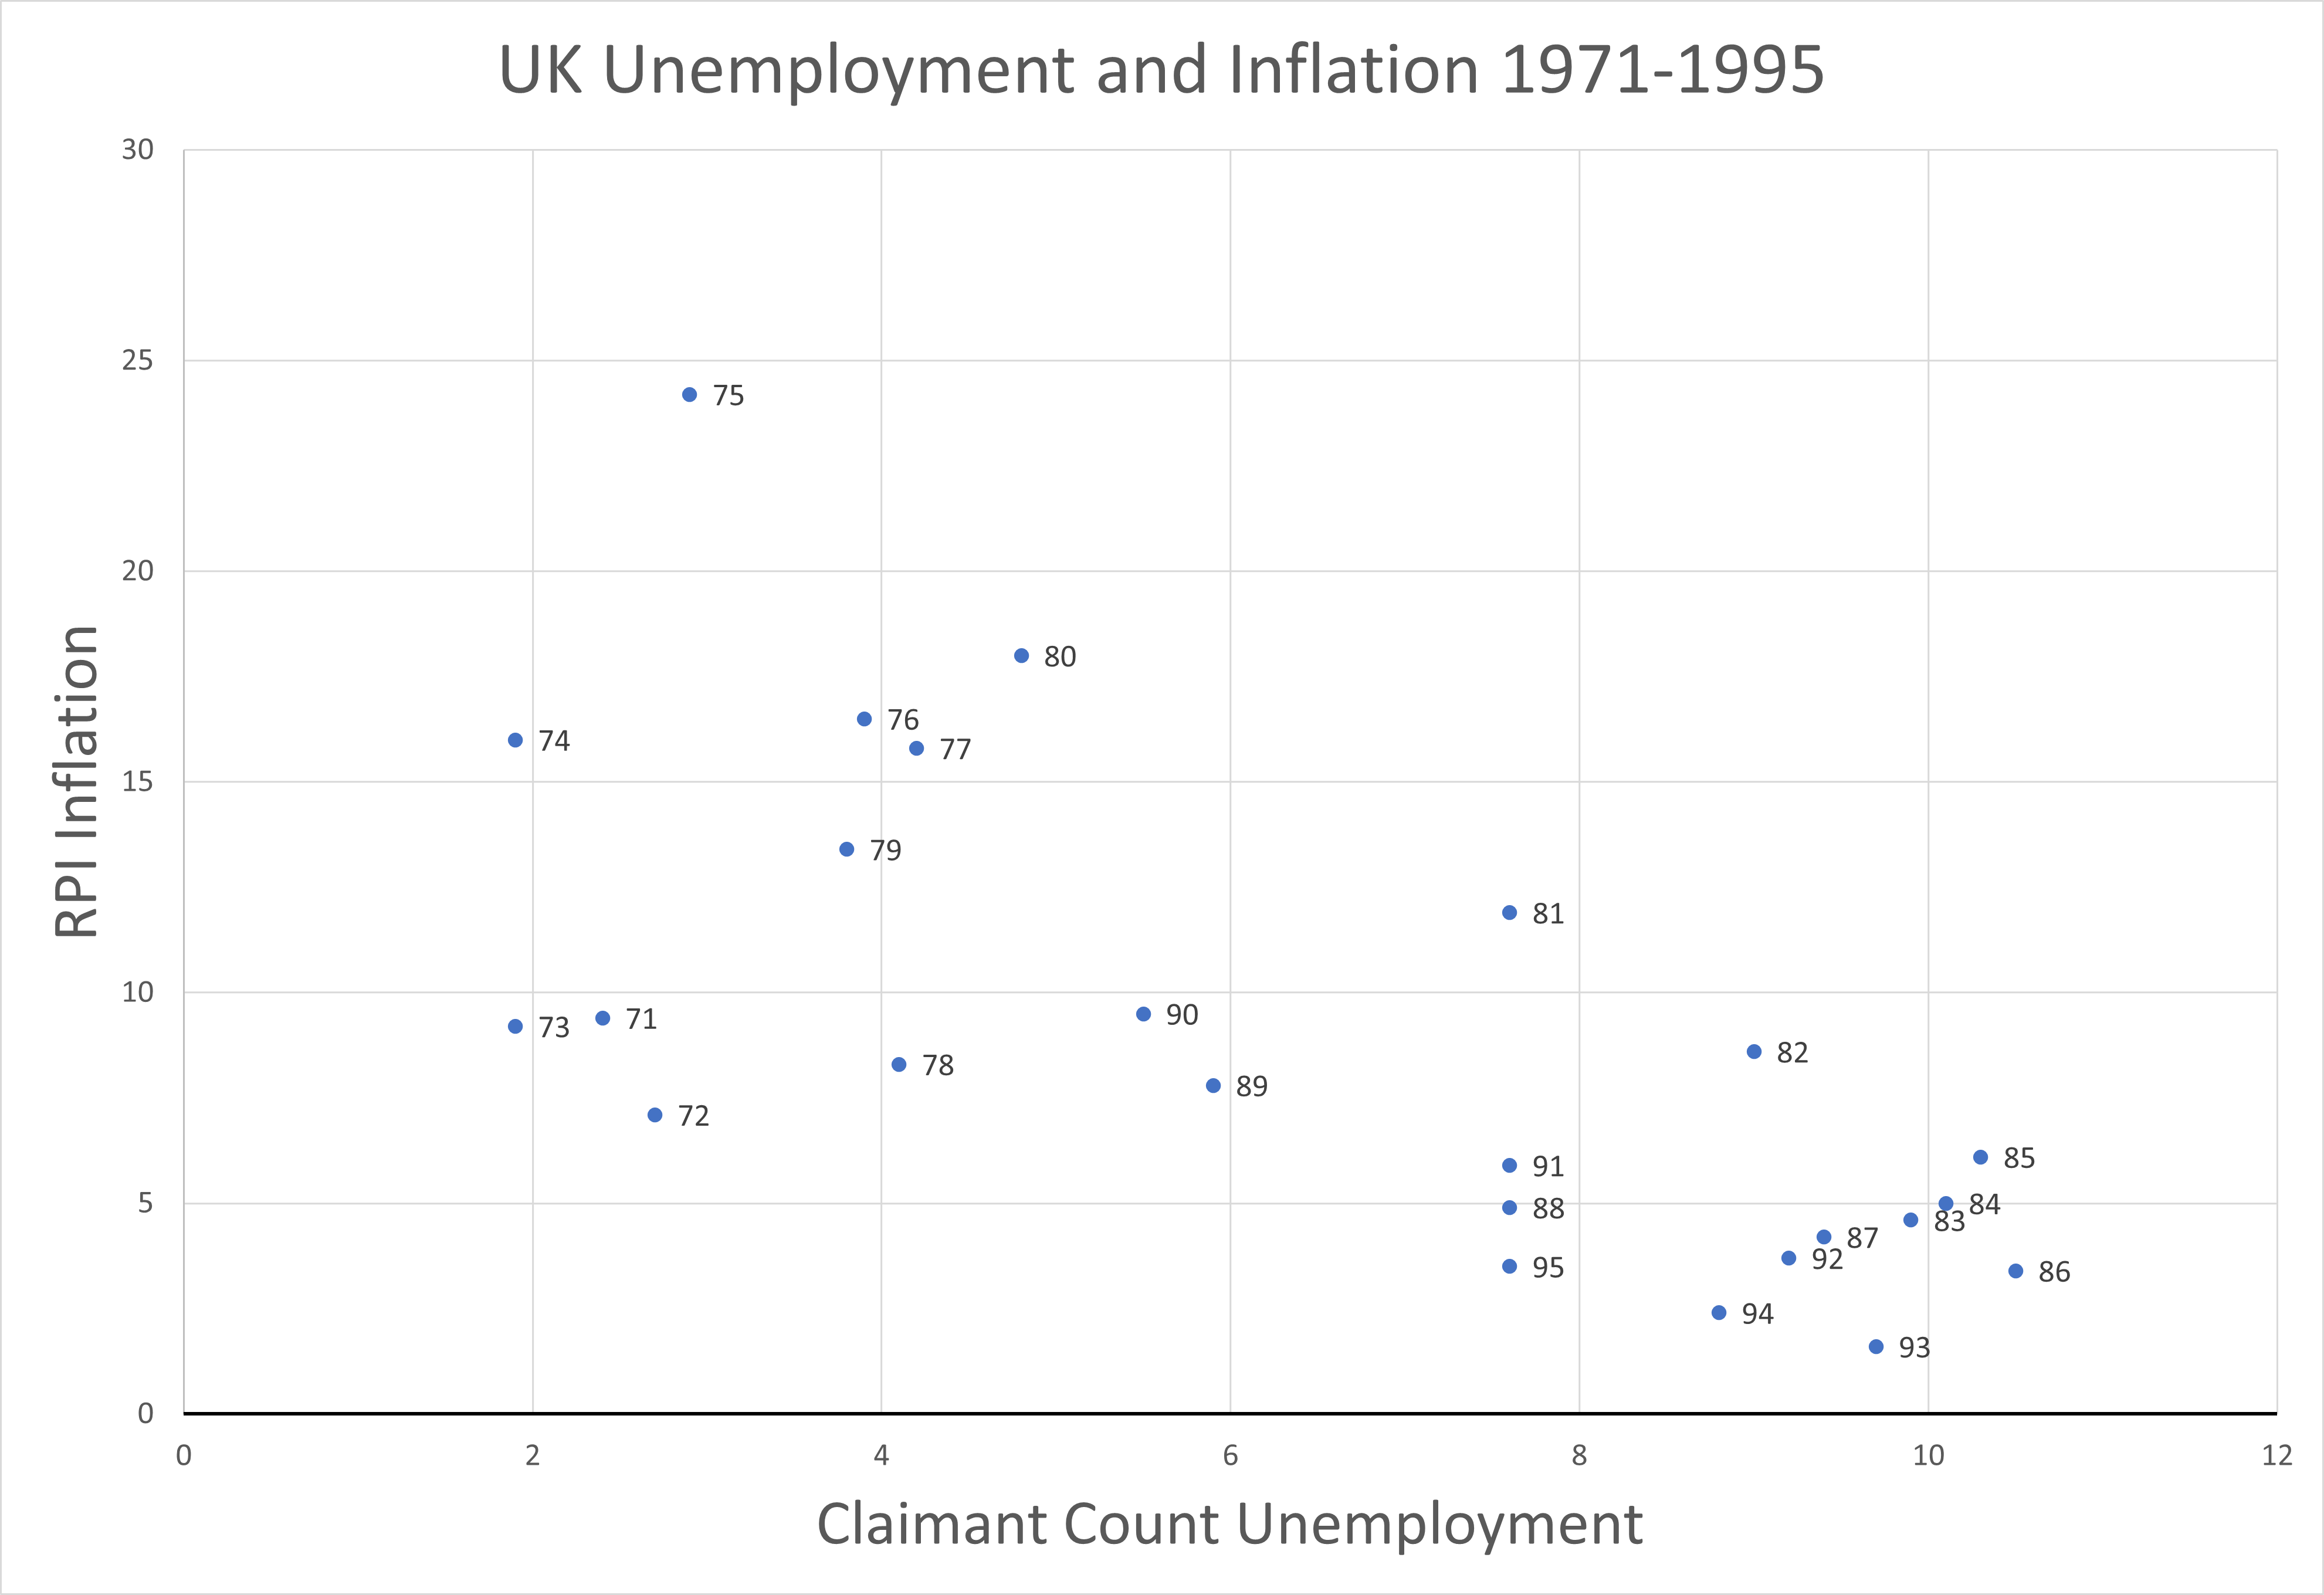
- Comment on the values of the inflation and unemployment figures in the following time periods:
- 1974-1979
- 1980-1986
- 1987-1995
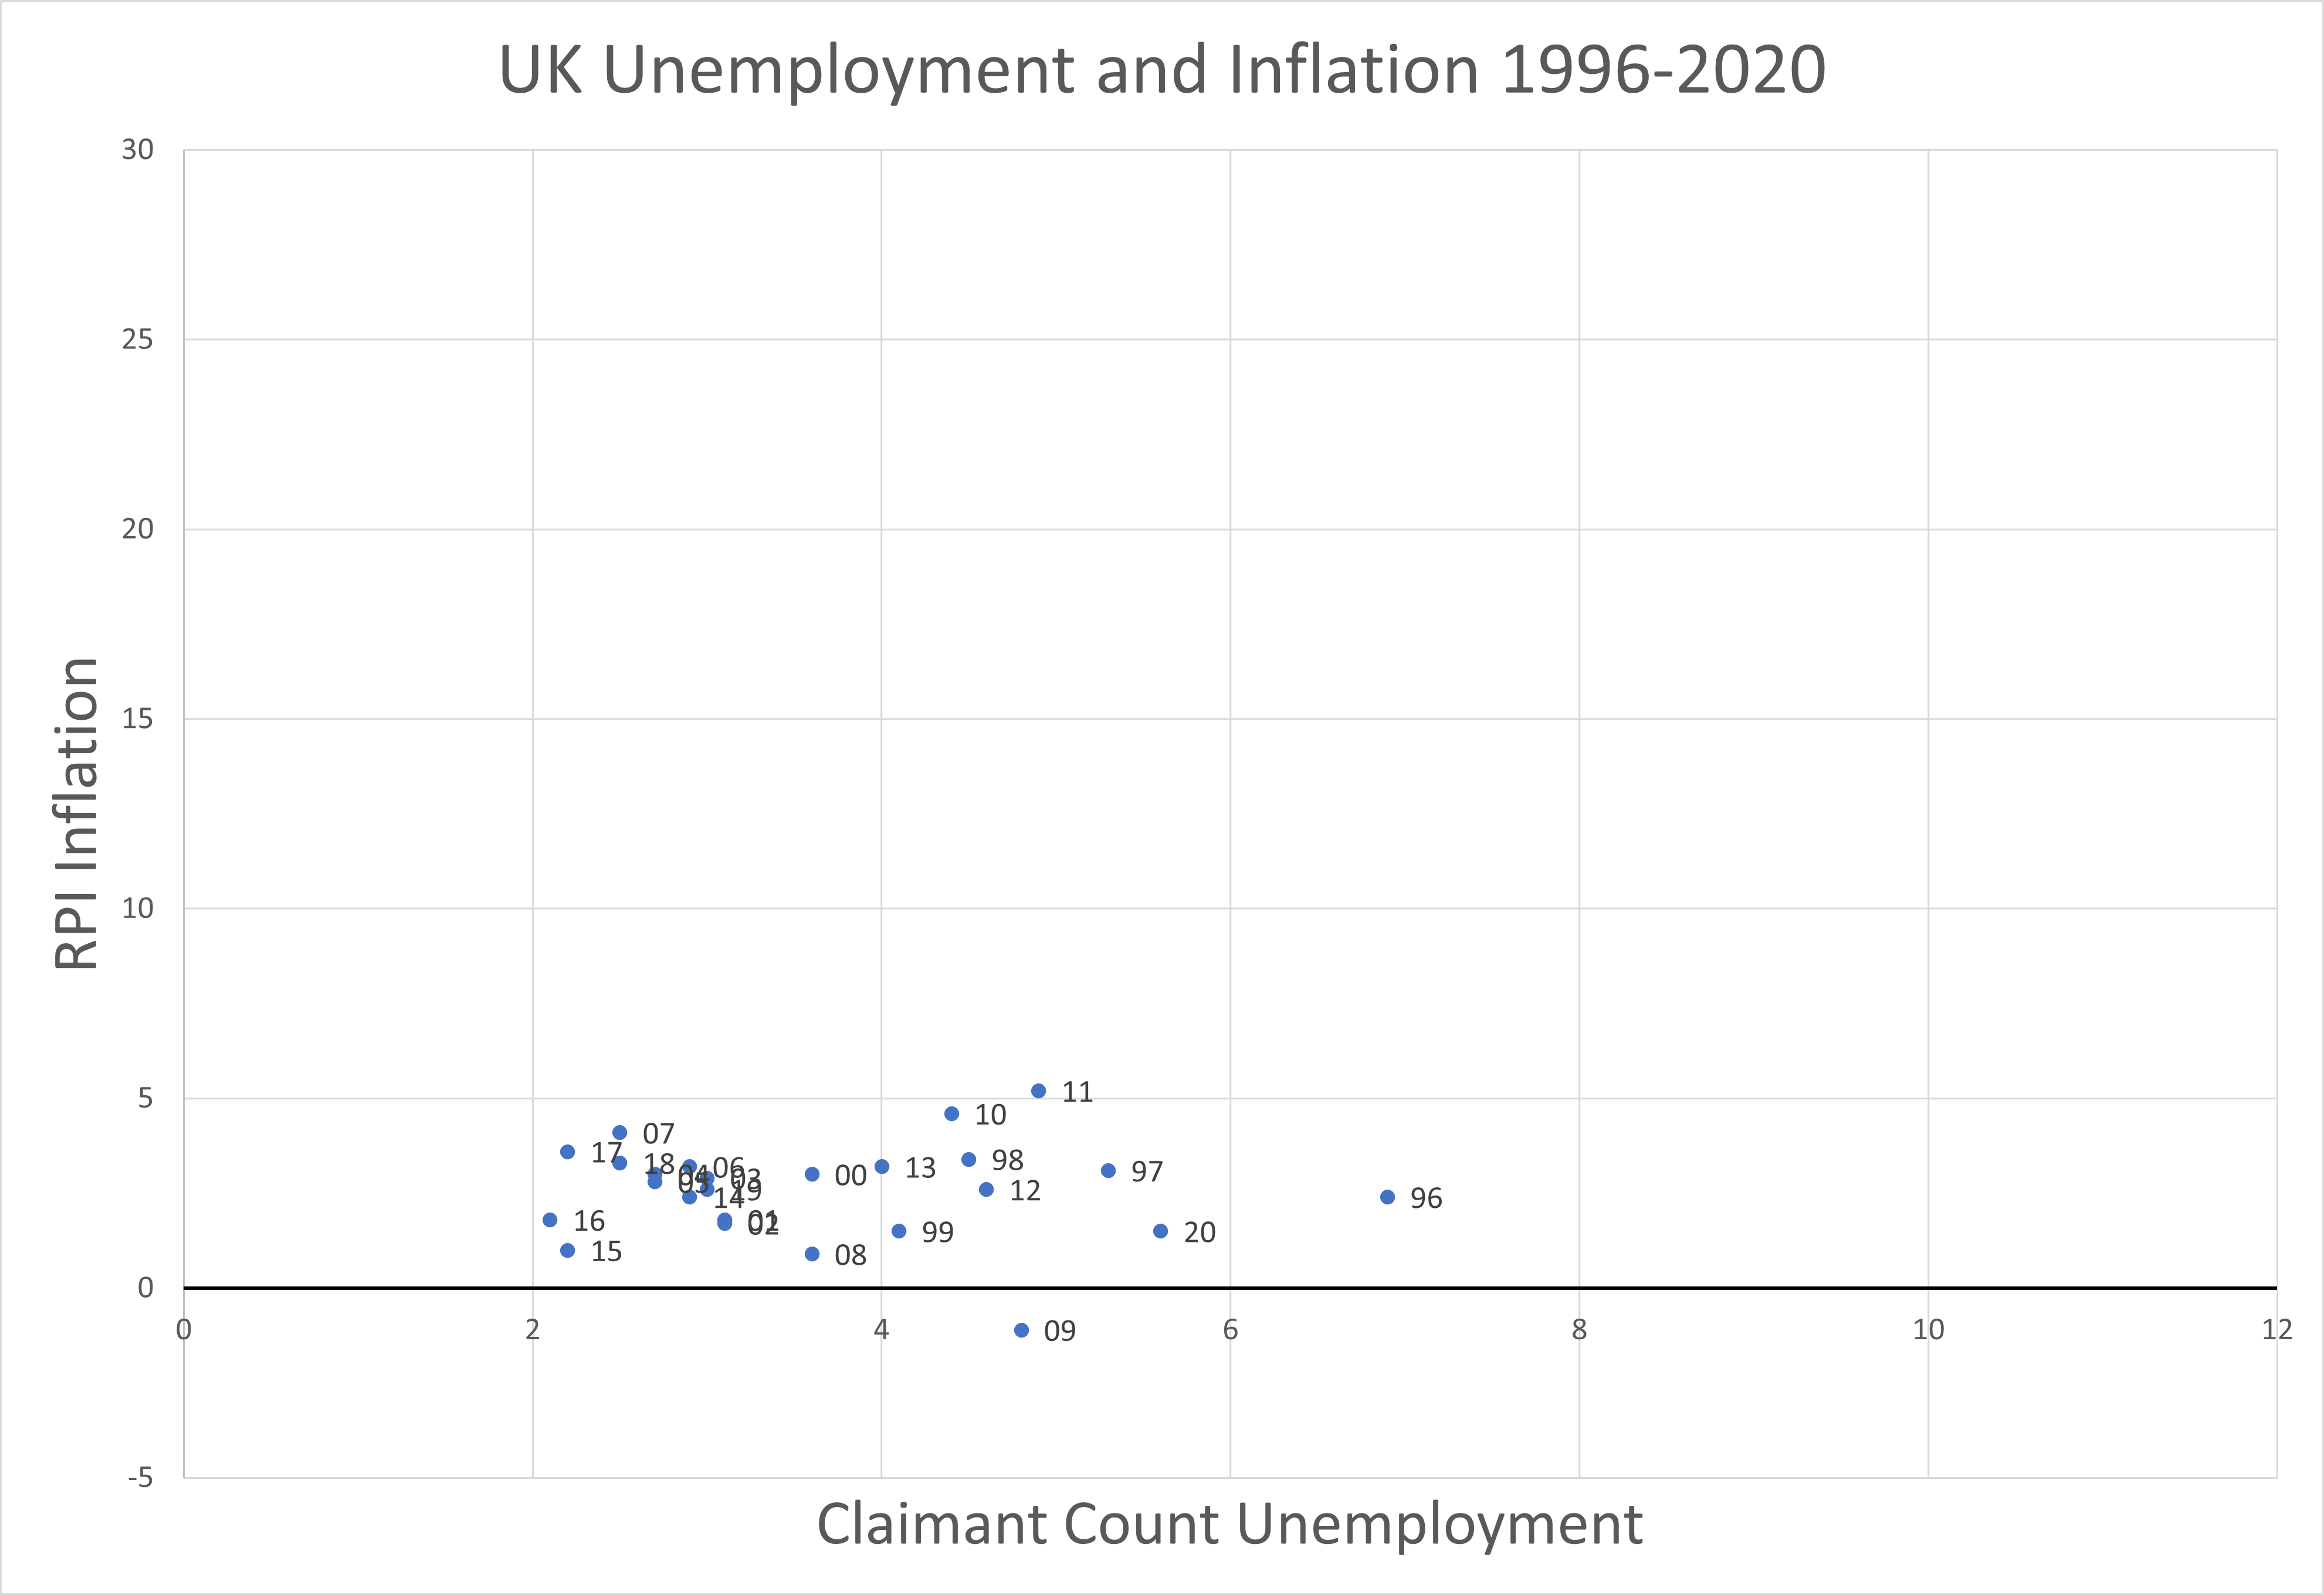
- What appears to have happened to the Phillips Curve relationship in this time period?
- Comment on the values of the inflation and unemployment figures in this time.
- Explain, using an AS/AD diagarm, how an economy can experience low unemployment without causing inflation
When finished:
- Explain how the role of inflationary expectations can affect the Phillips Curve.
- Explain the reason why inflationary expectations may have changed at the following points:
- 1974-1975
- 1985-1987
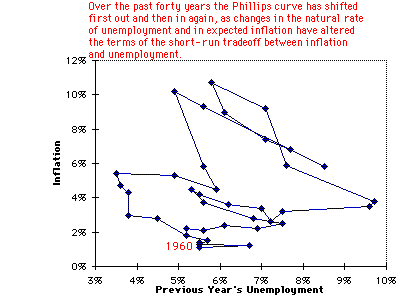
This animation does a nice job to explain what we have seen earlier: that the Phillips Curve can shift around and become more or less favourable, depending on inflationary expectations.